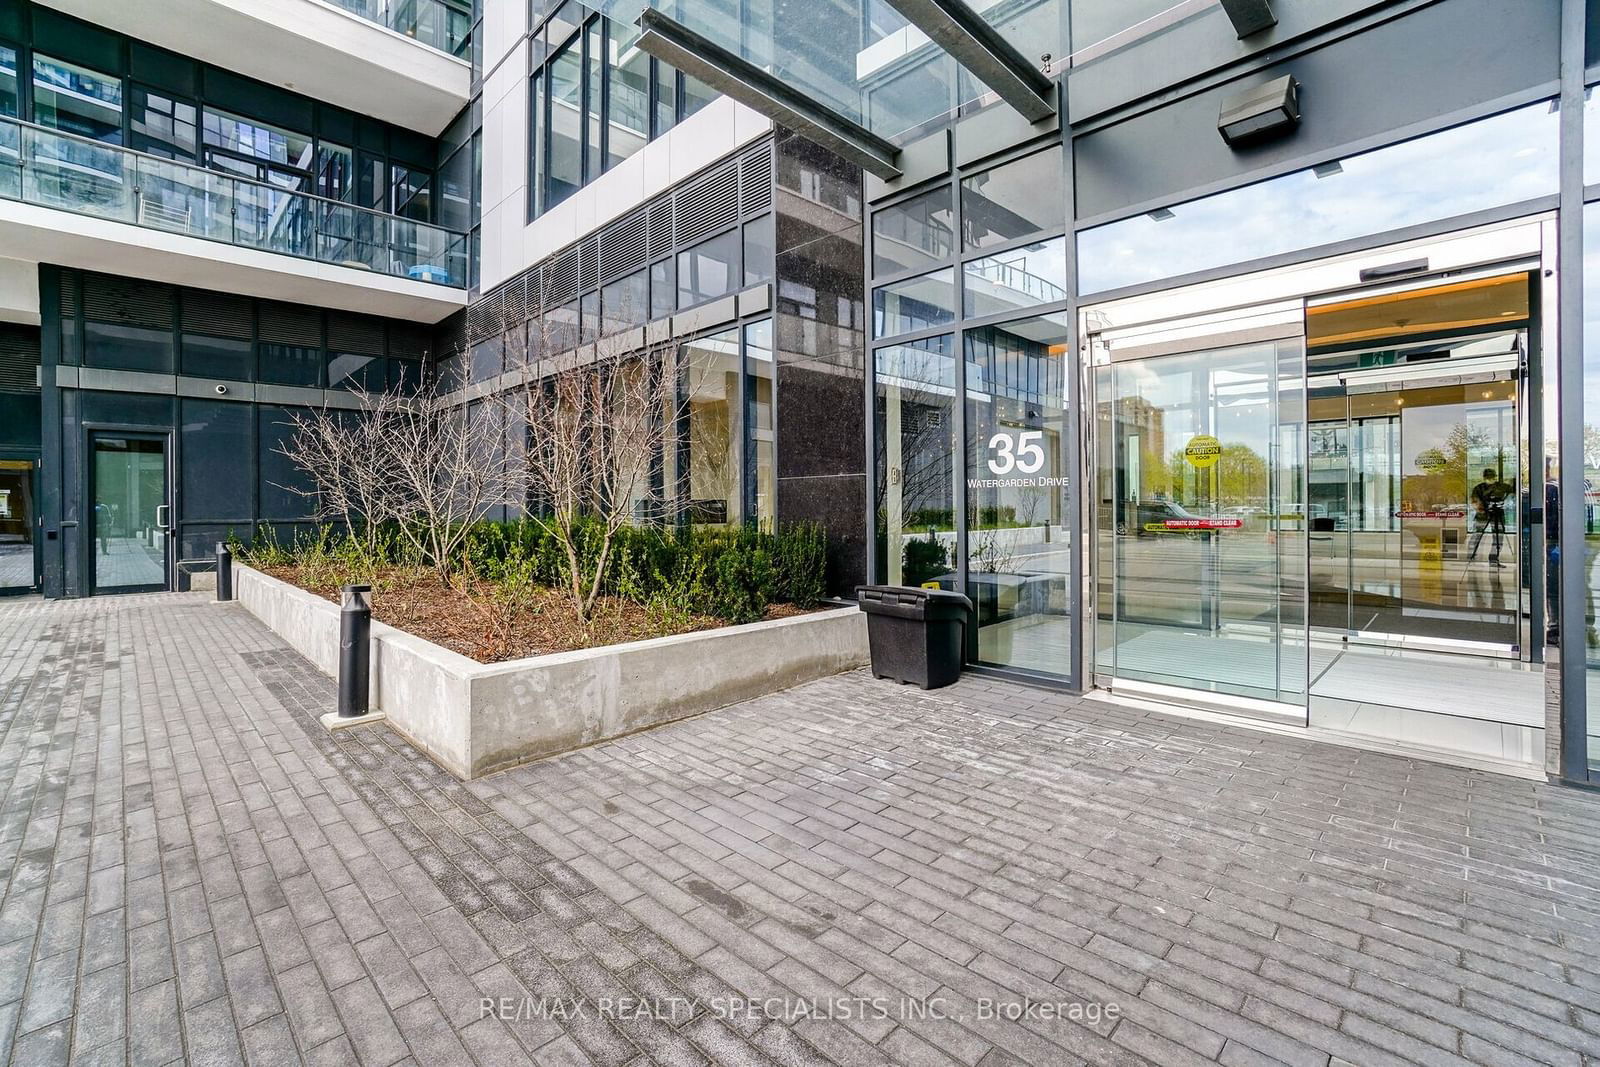
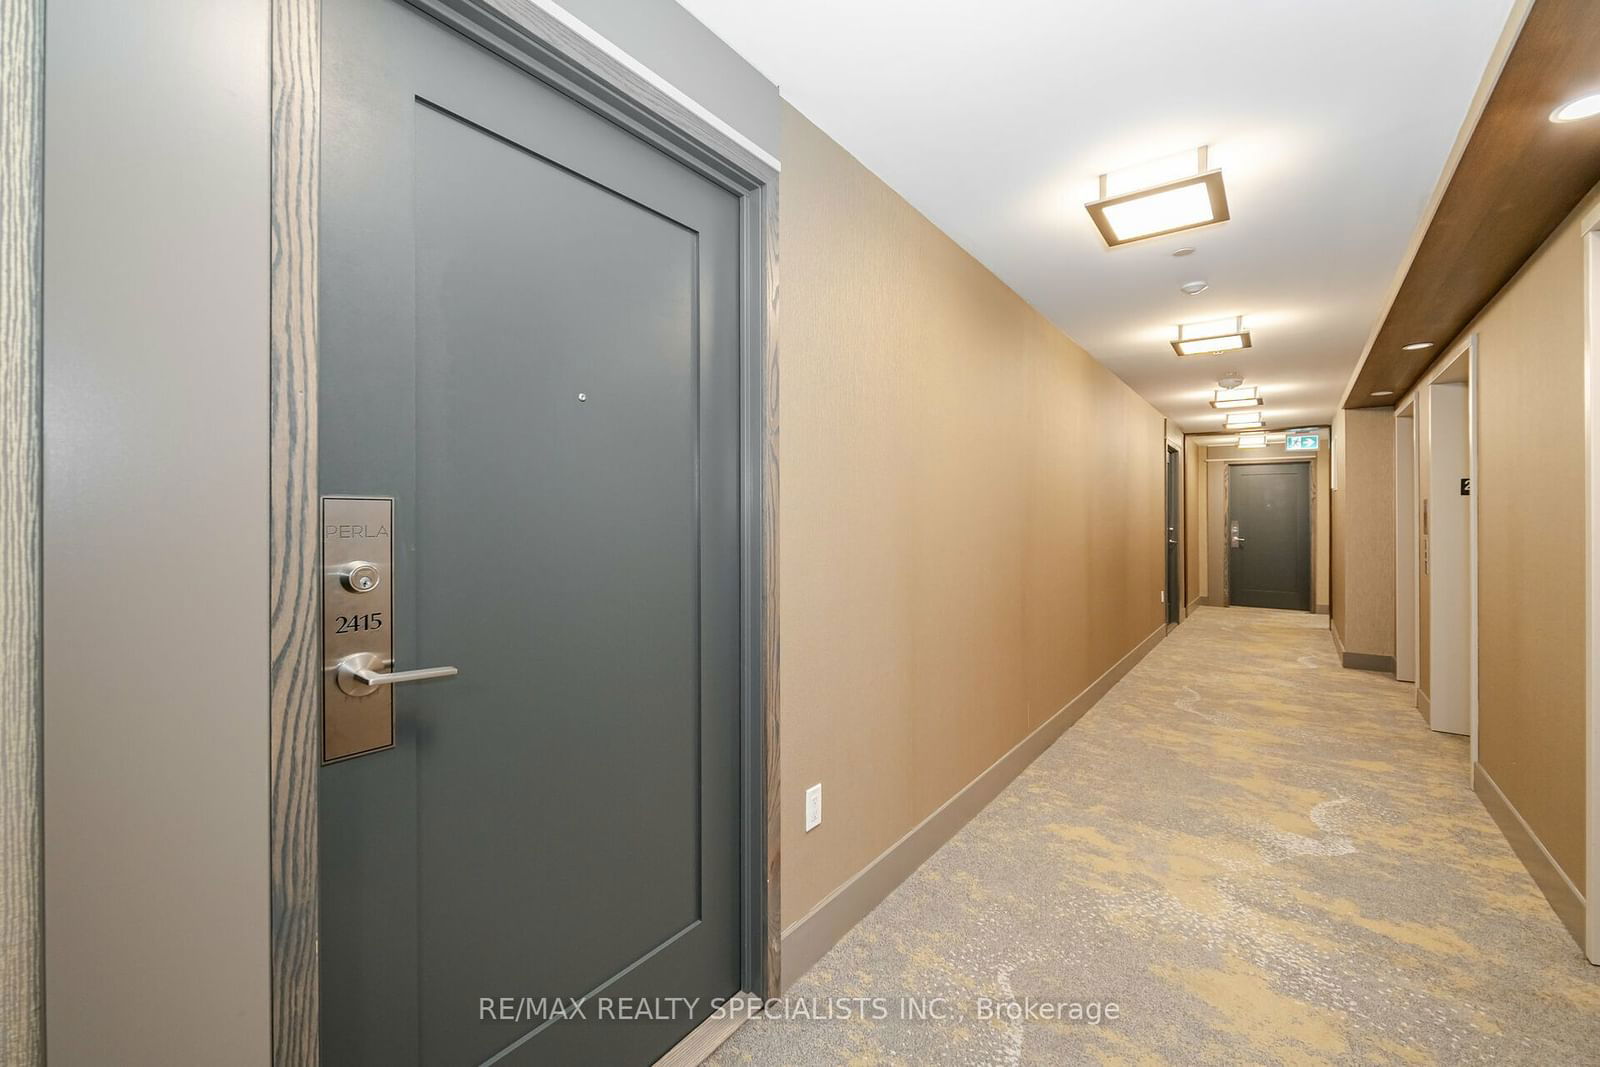
2415 - 35 Watergarden Dr
Listing History
Unit Highlights
Maintenance Fees
Utility Type
- Air Conditioning
- Central Air
- Heat Source
- Gas
- Heating
- Forced Air
Room Dimensions
About this Listing
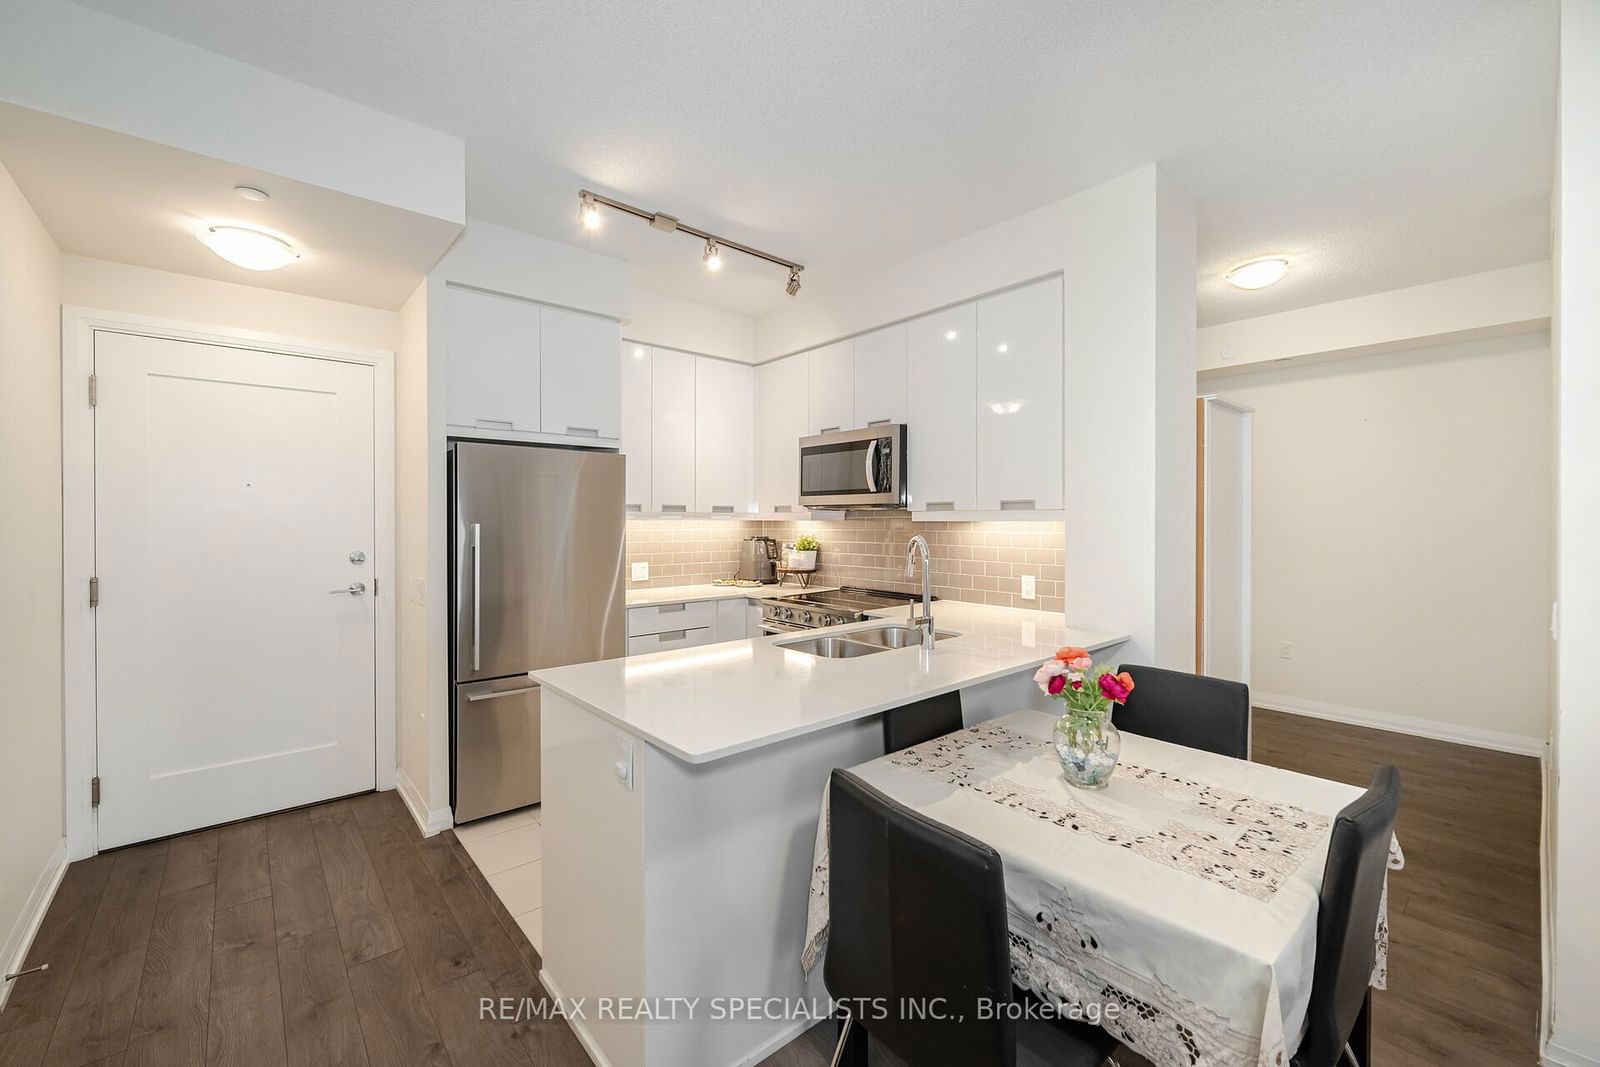
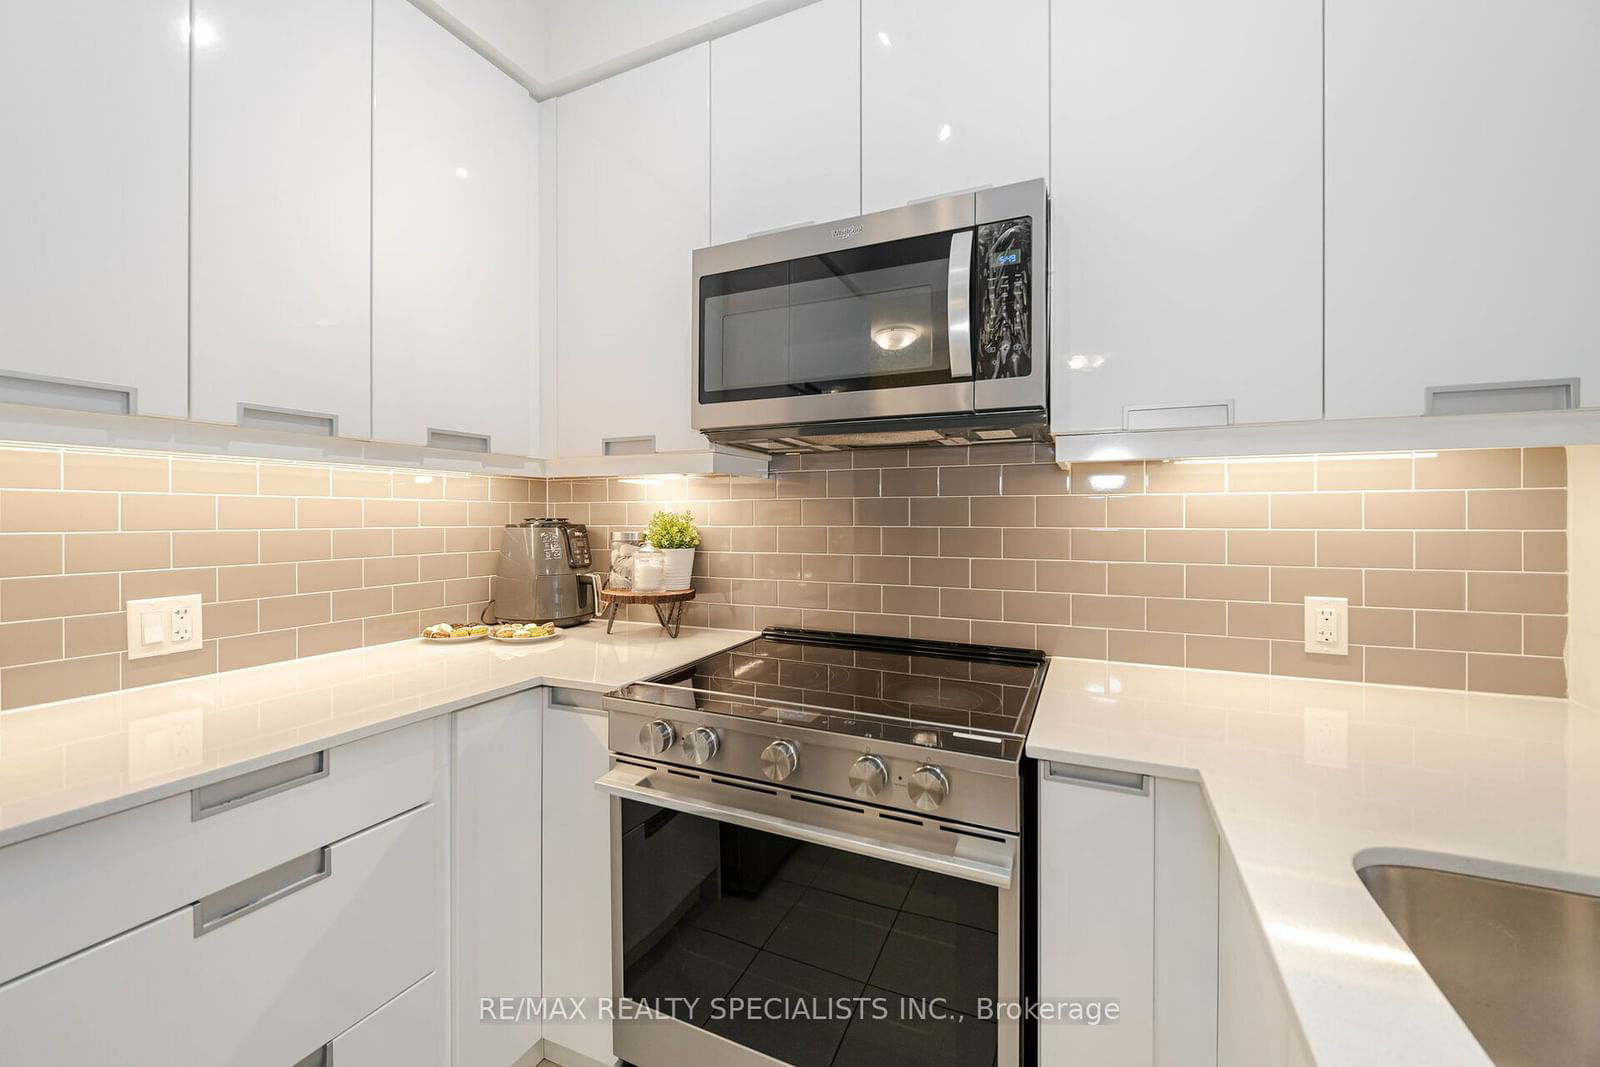
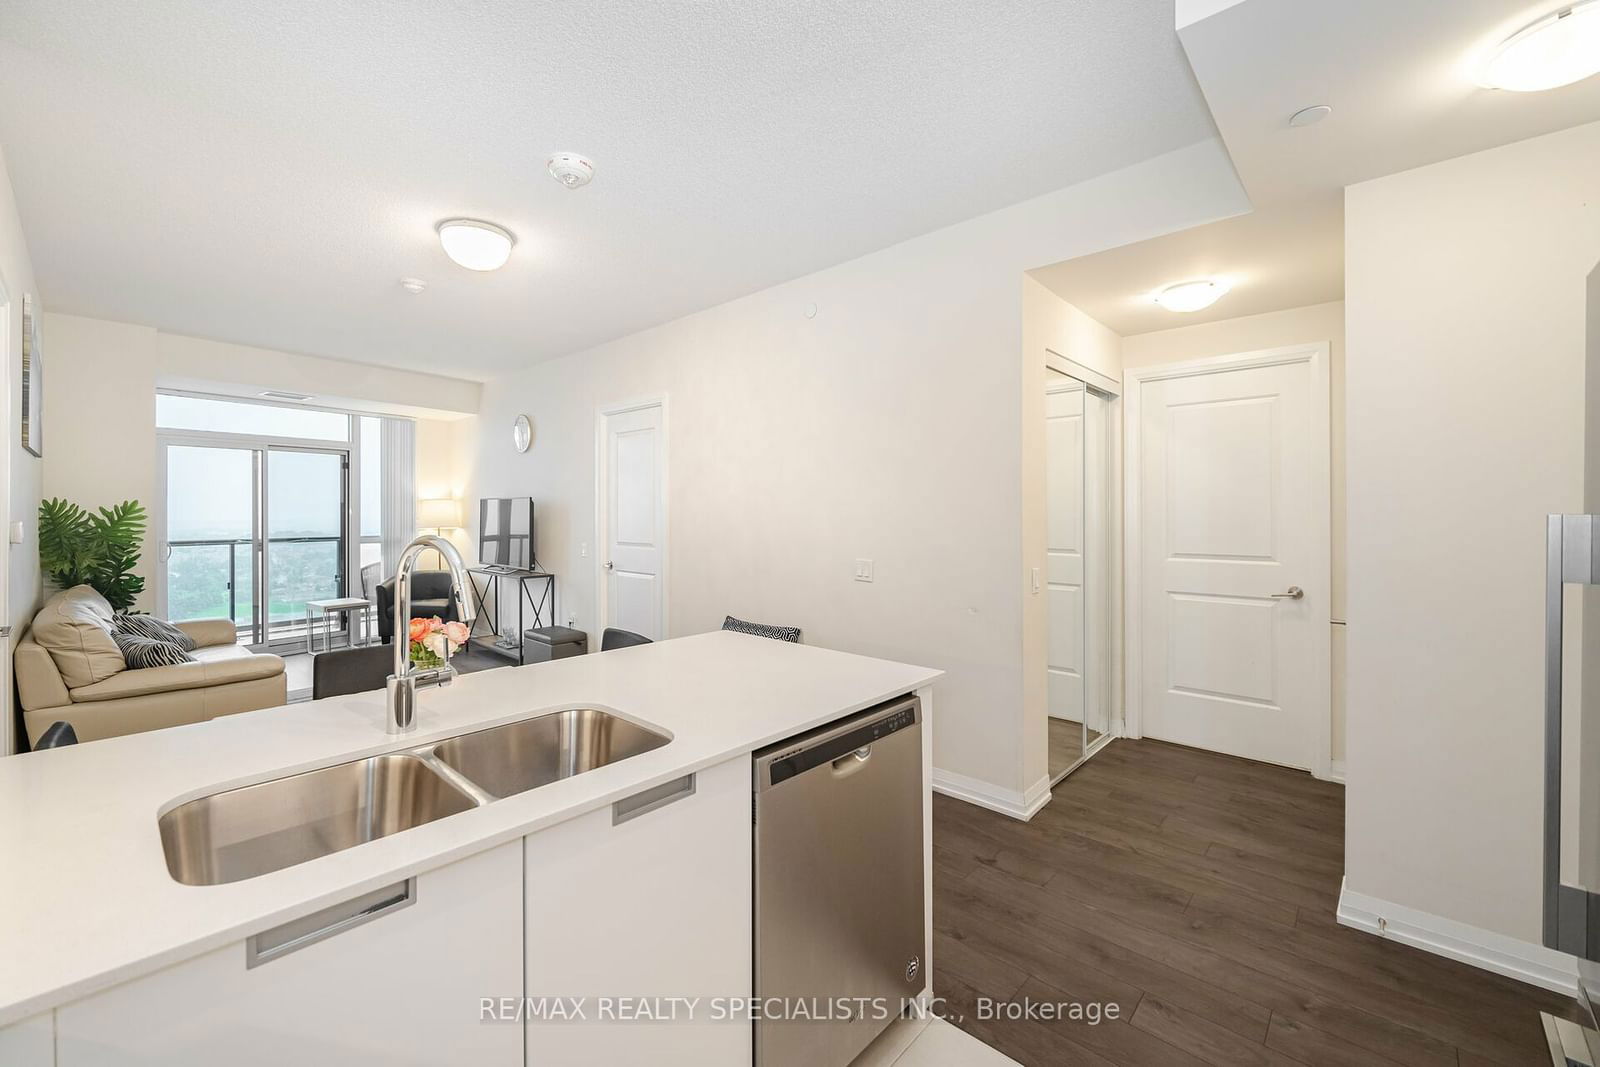
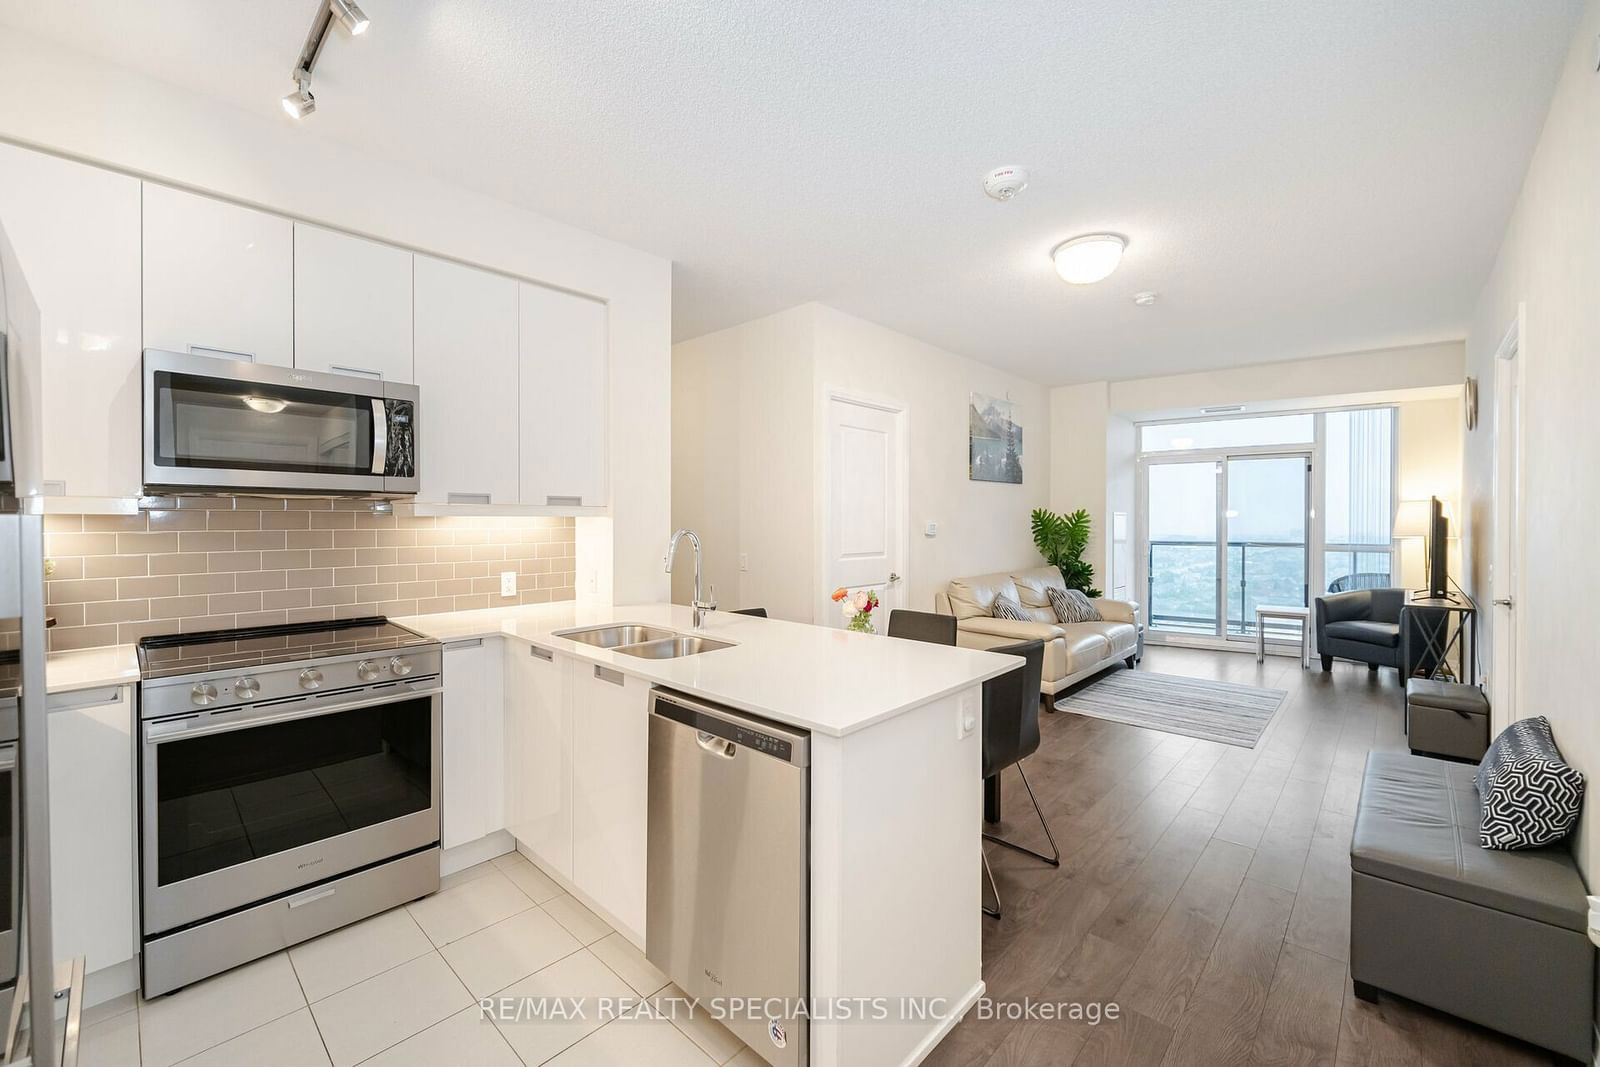
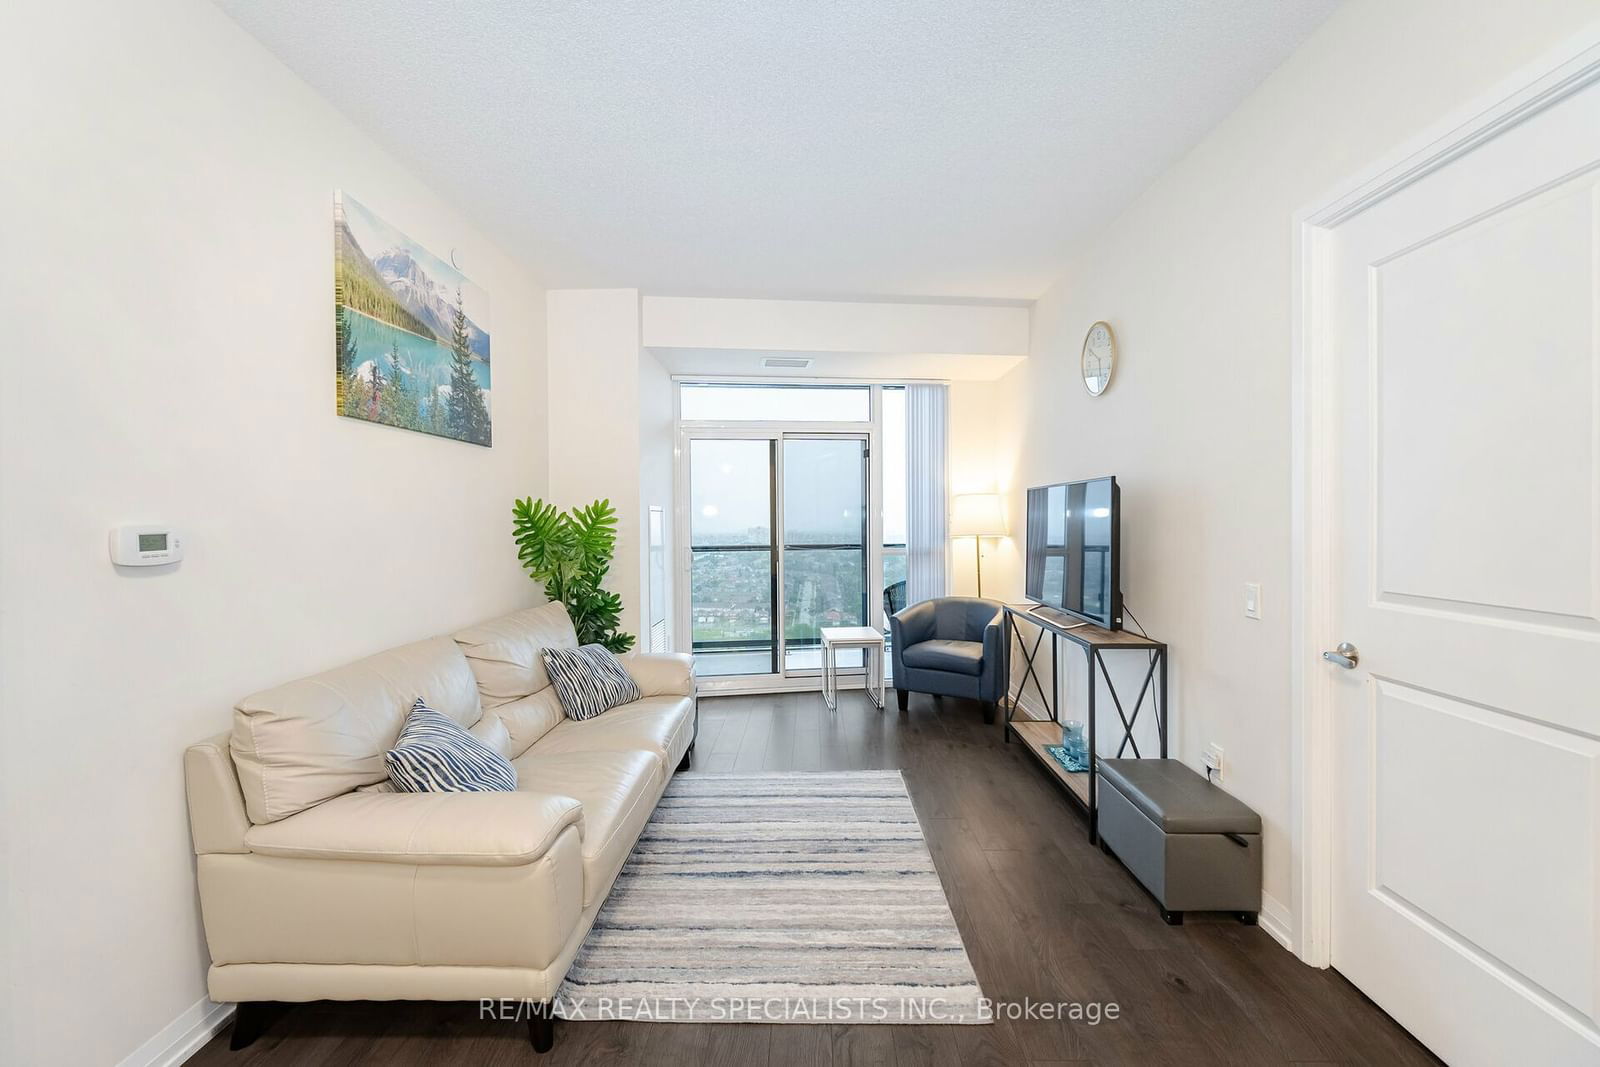
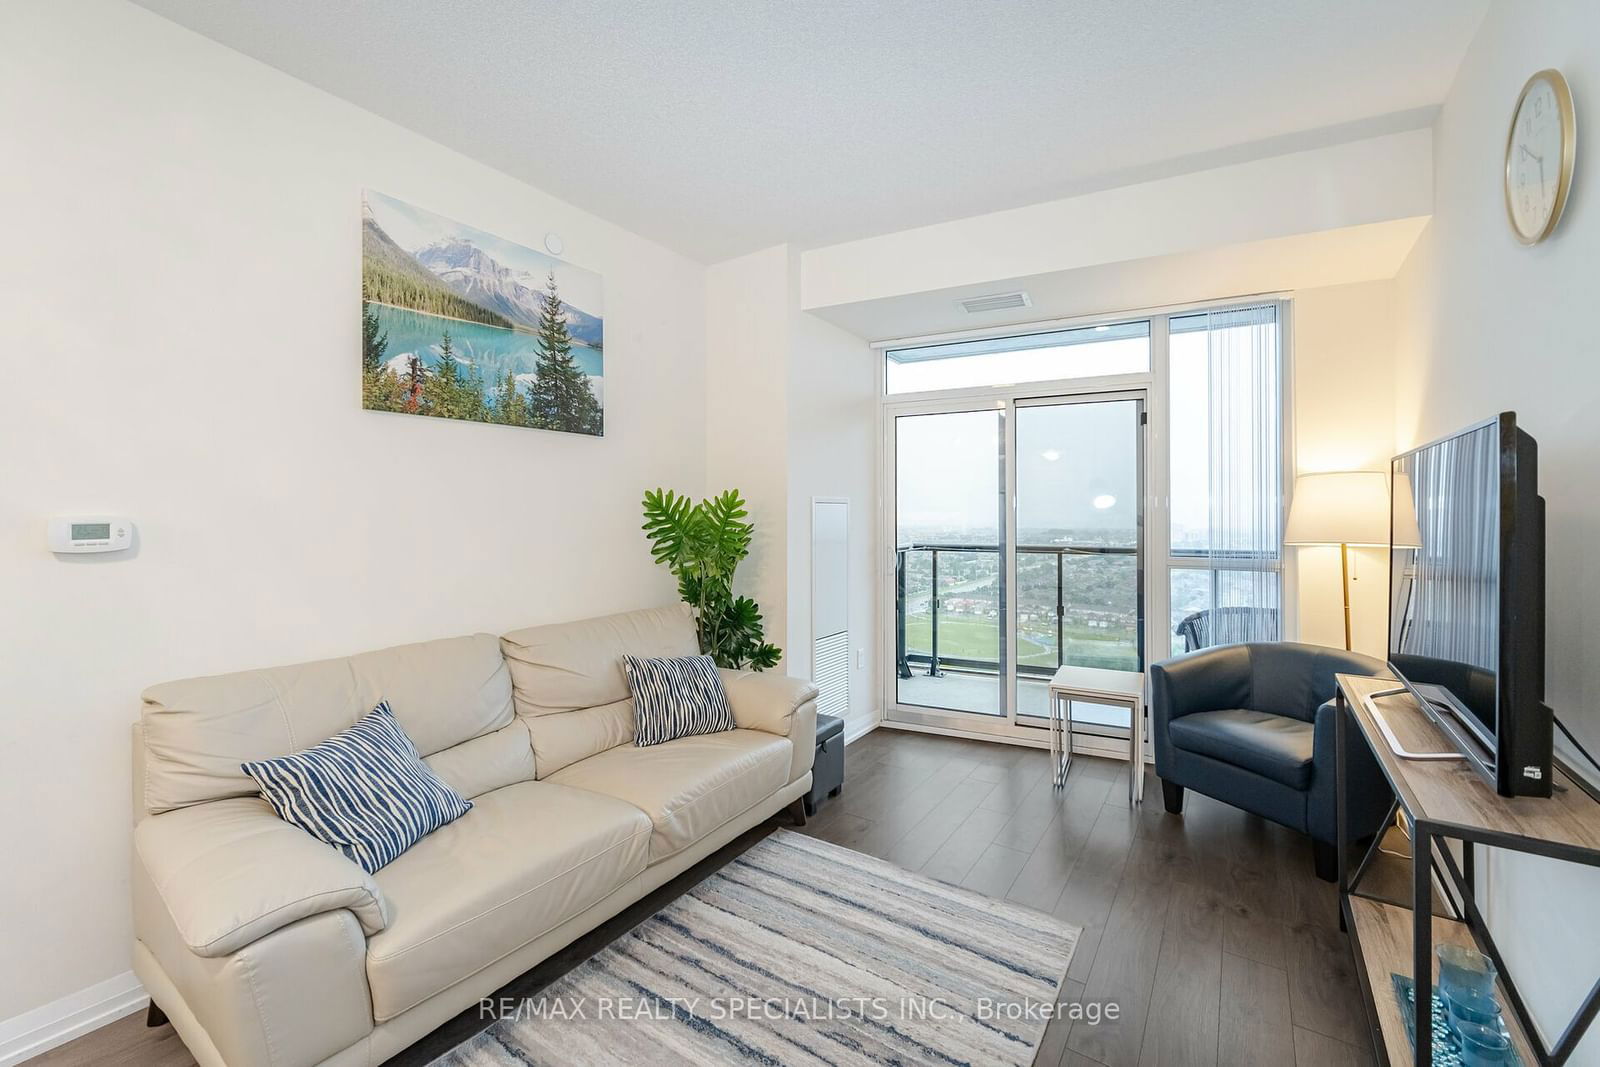
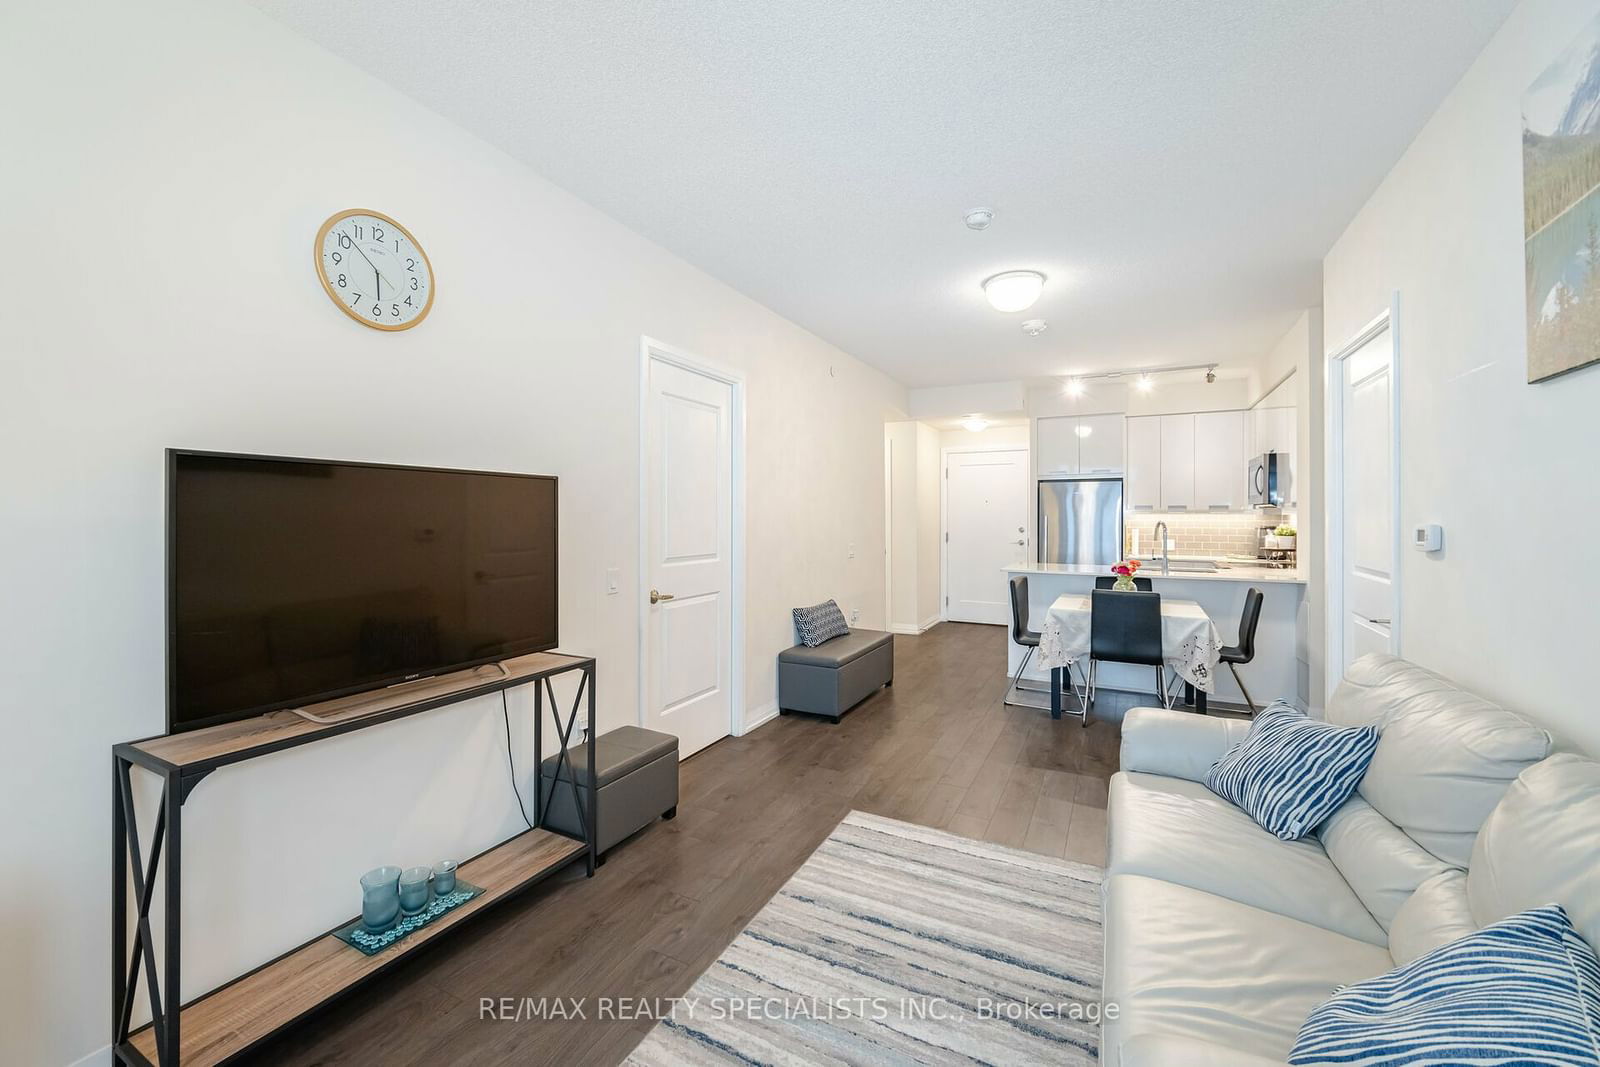
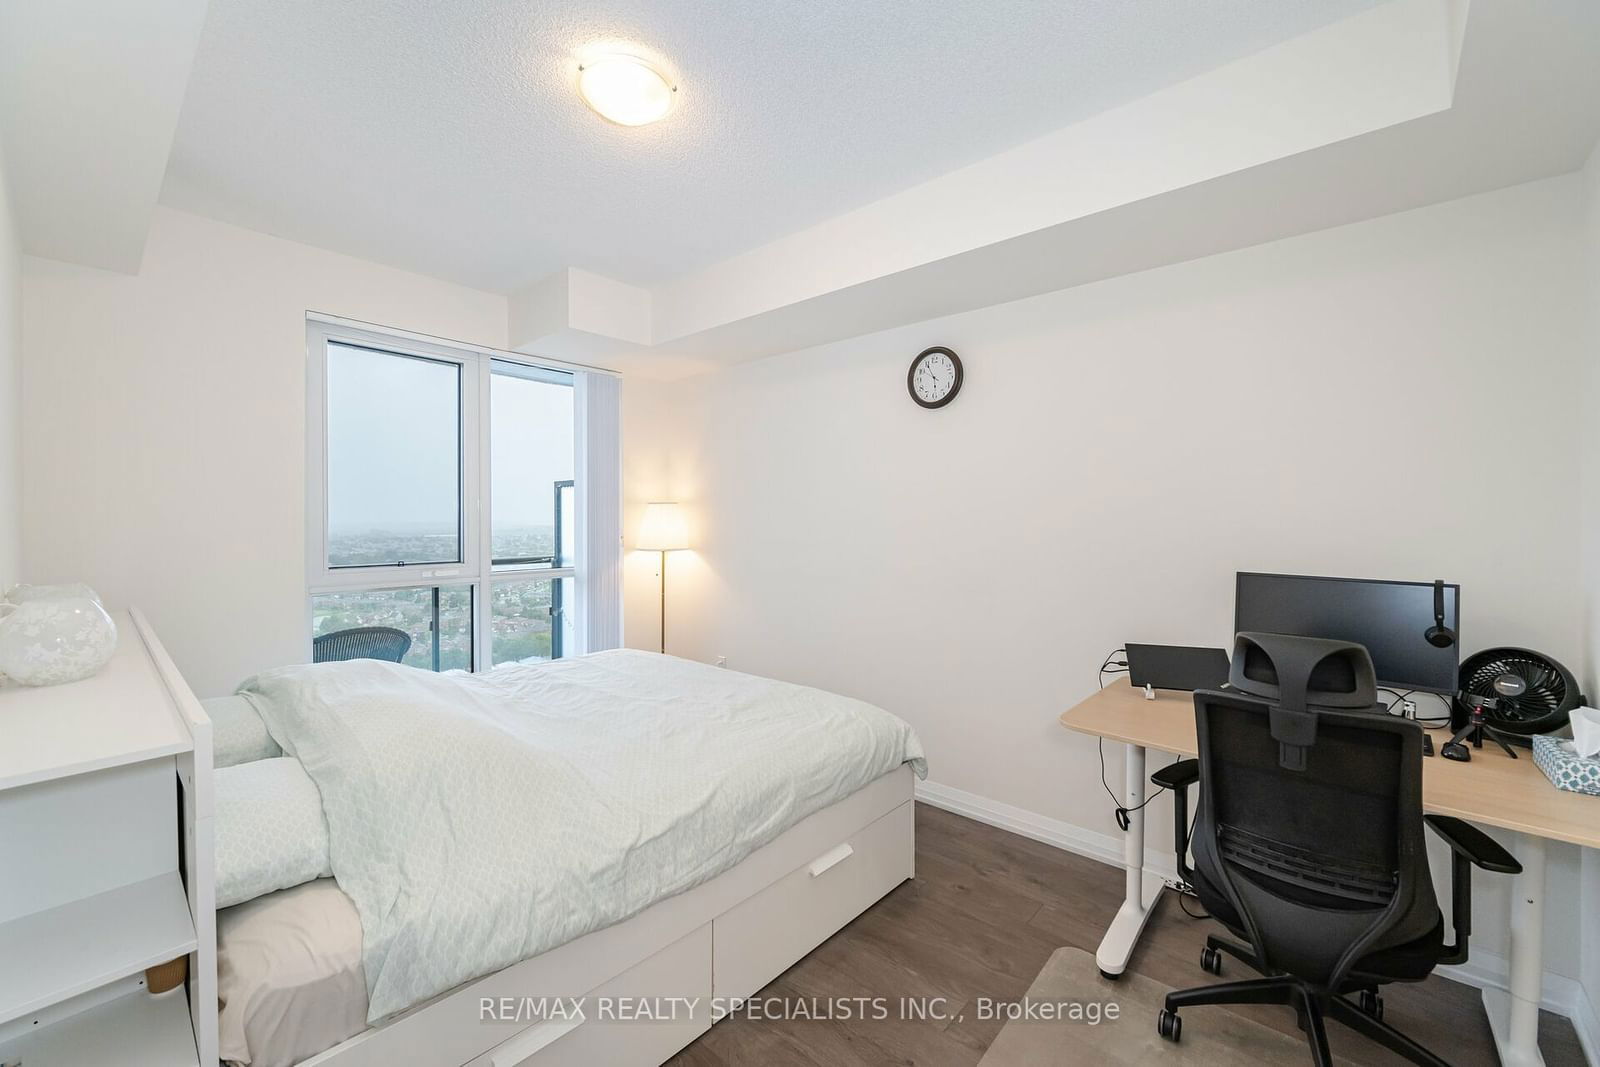
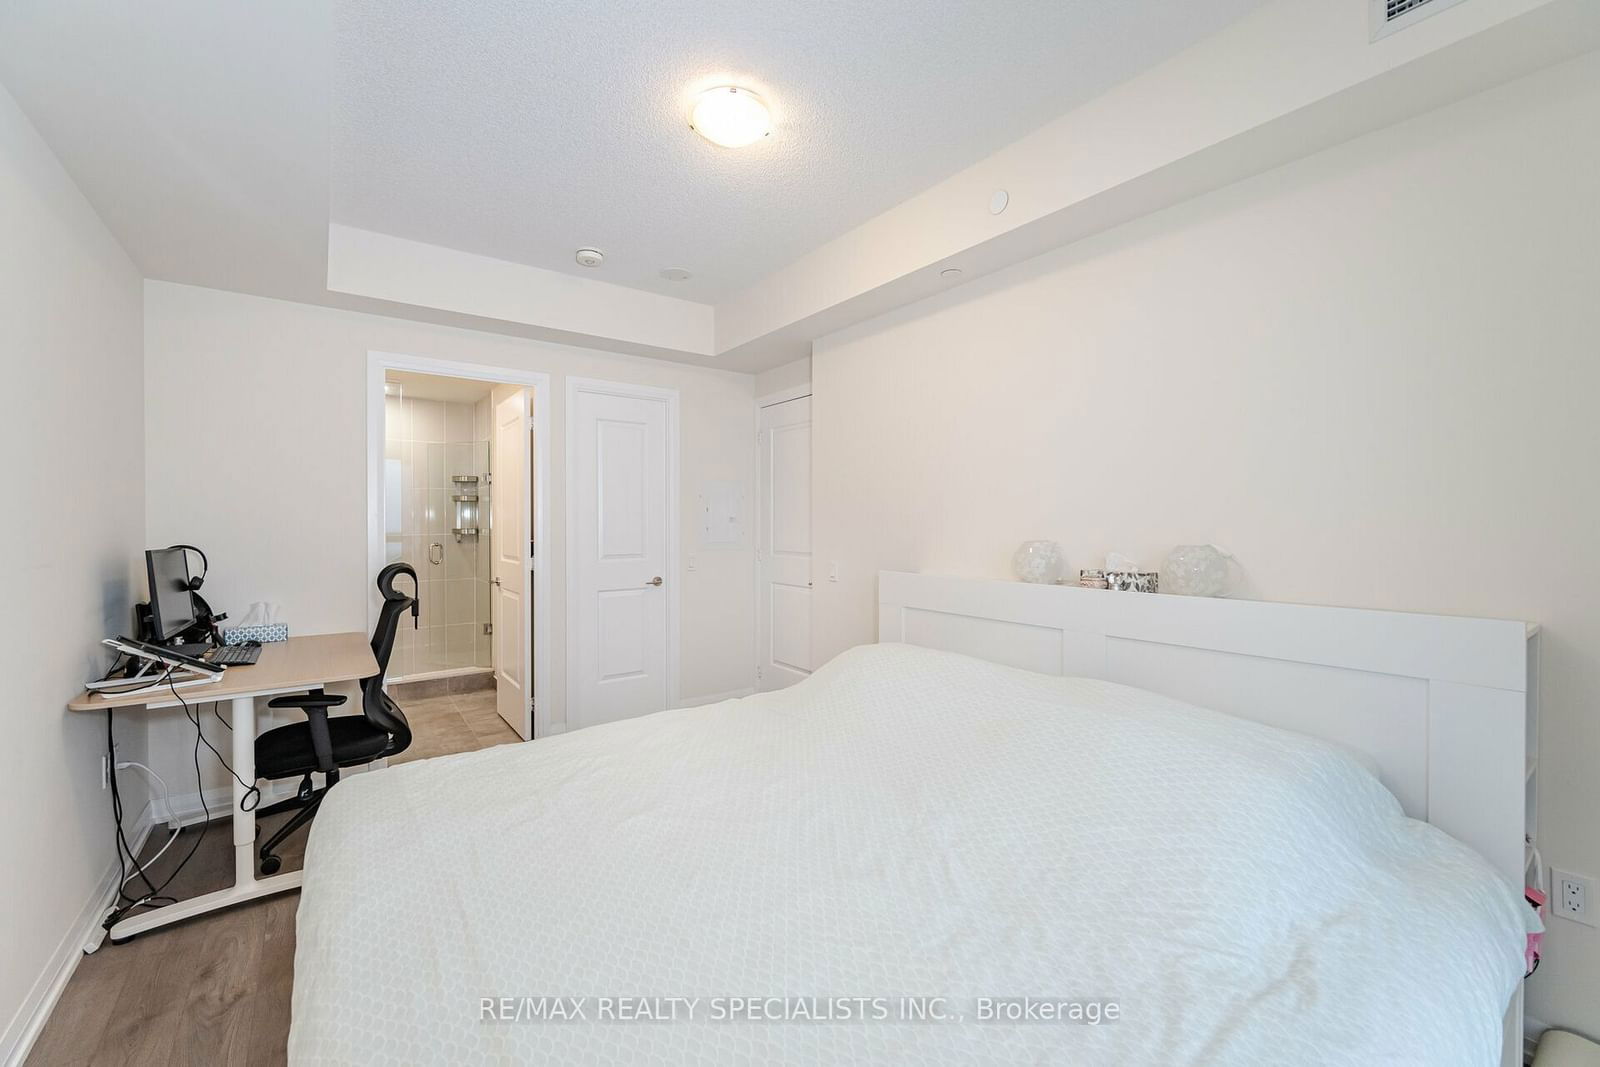
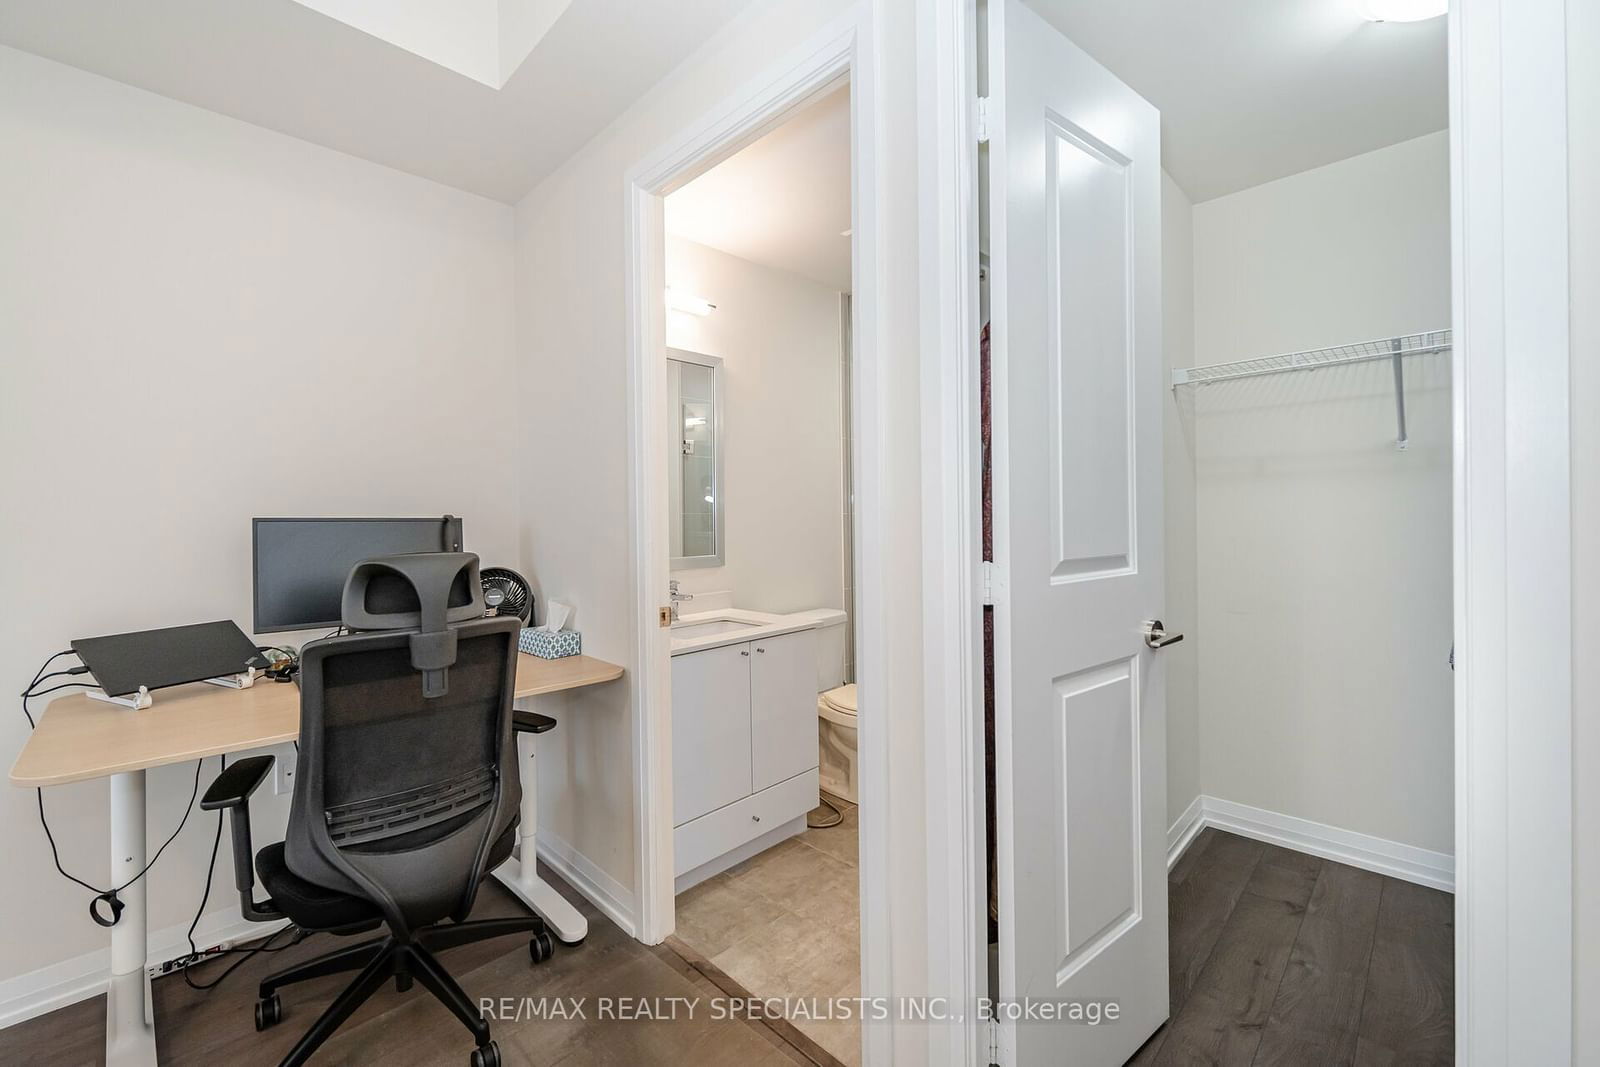
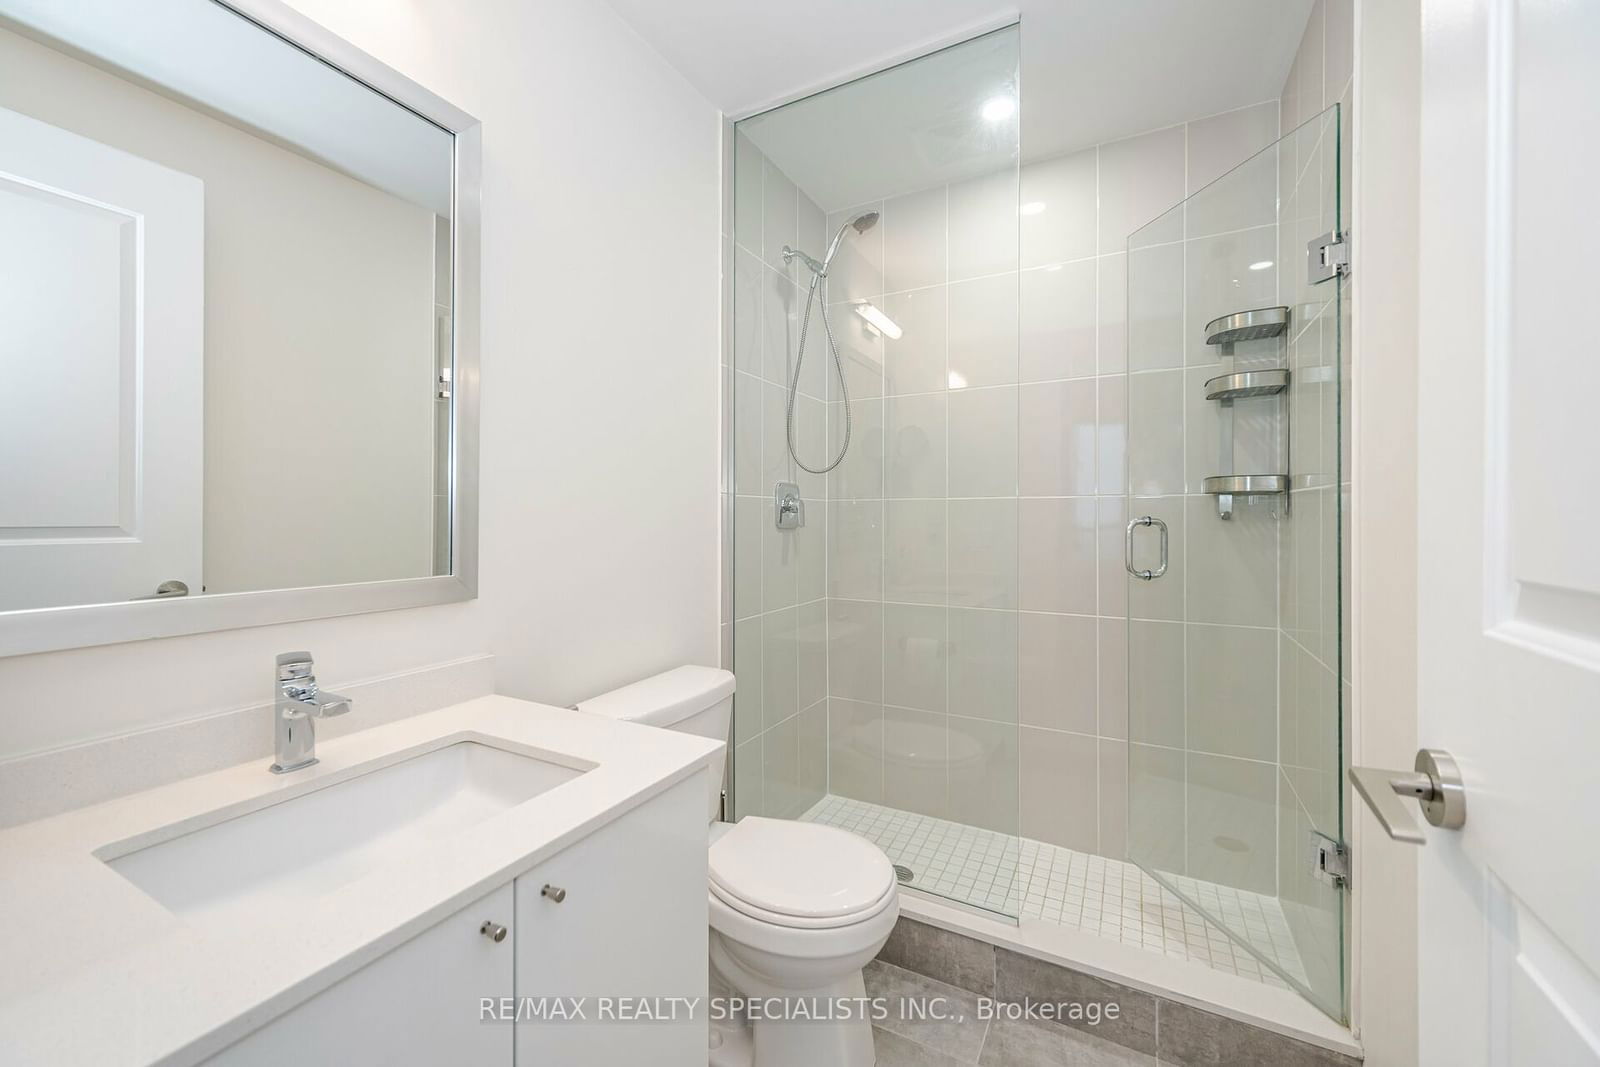
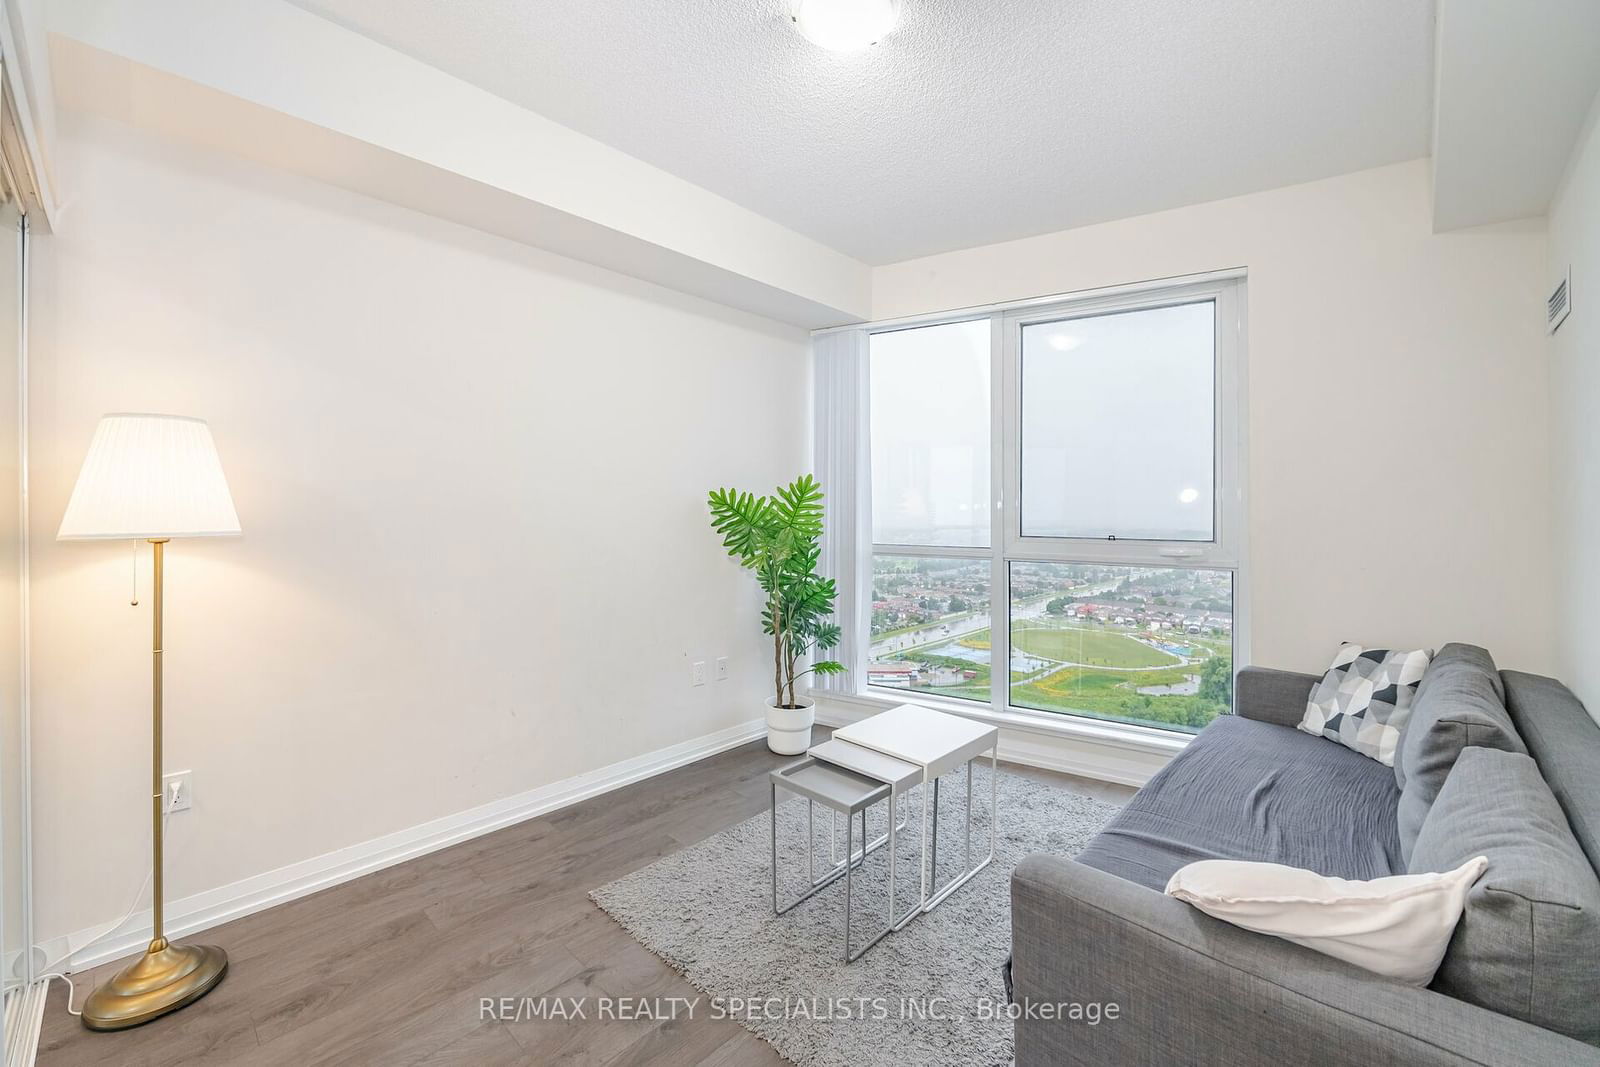
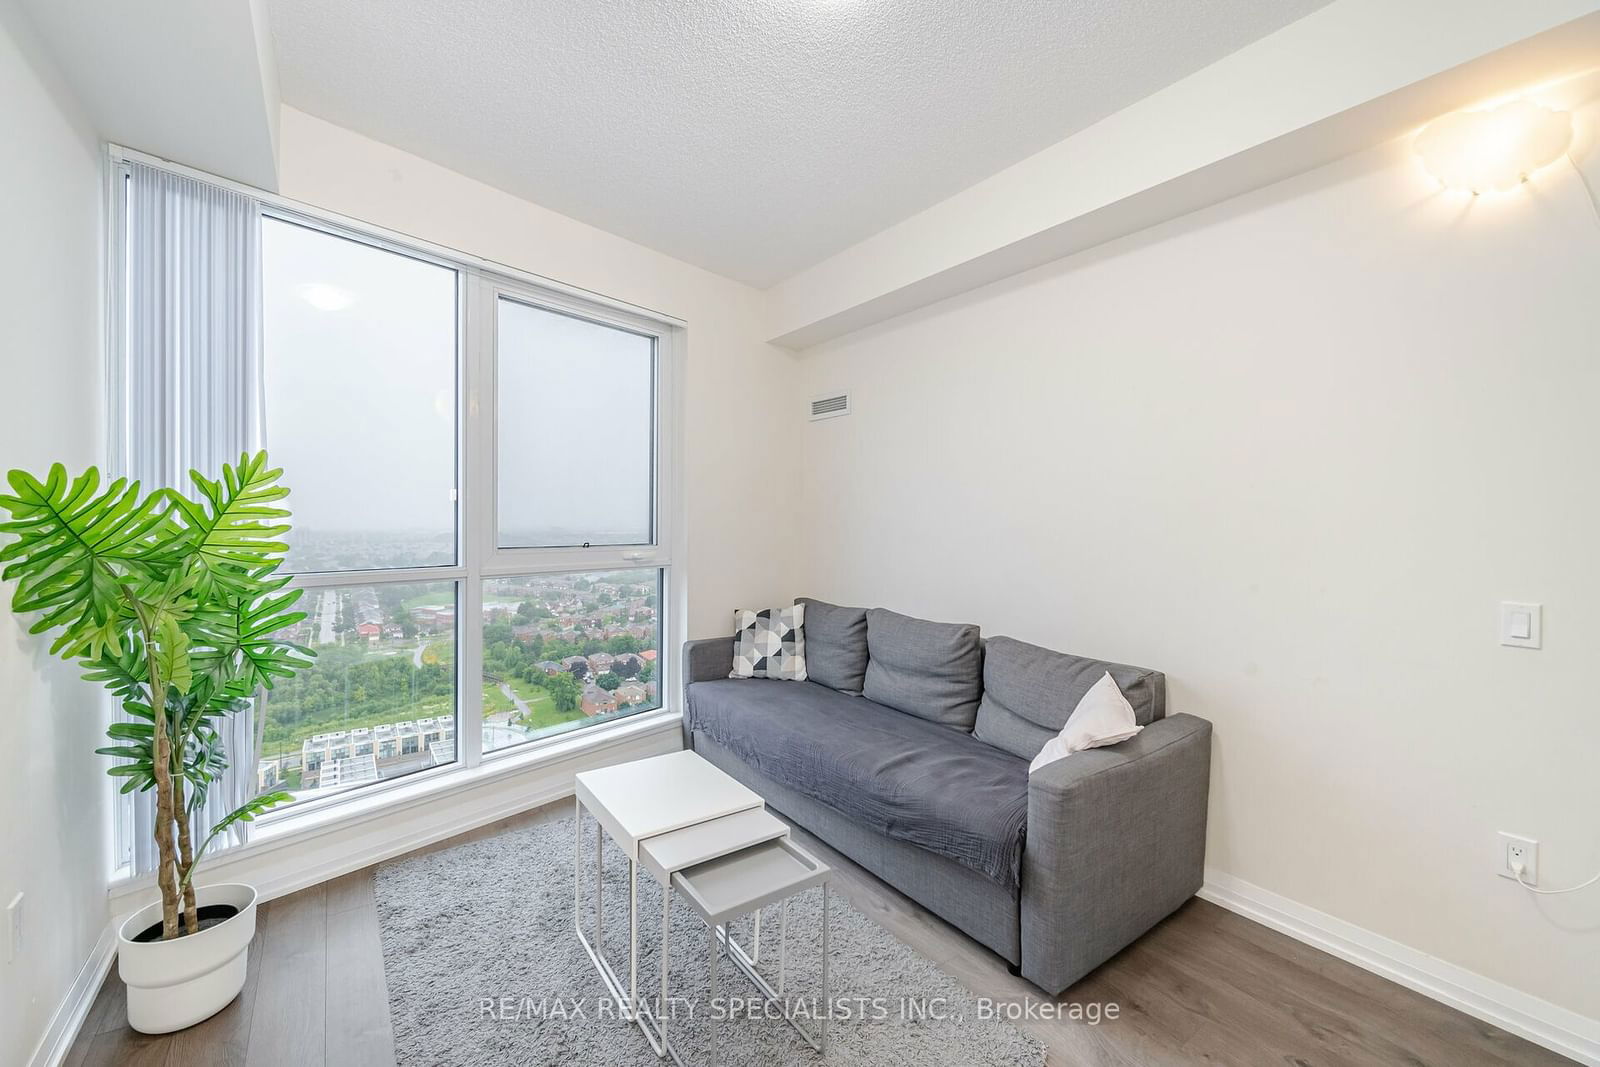
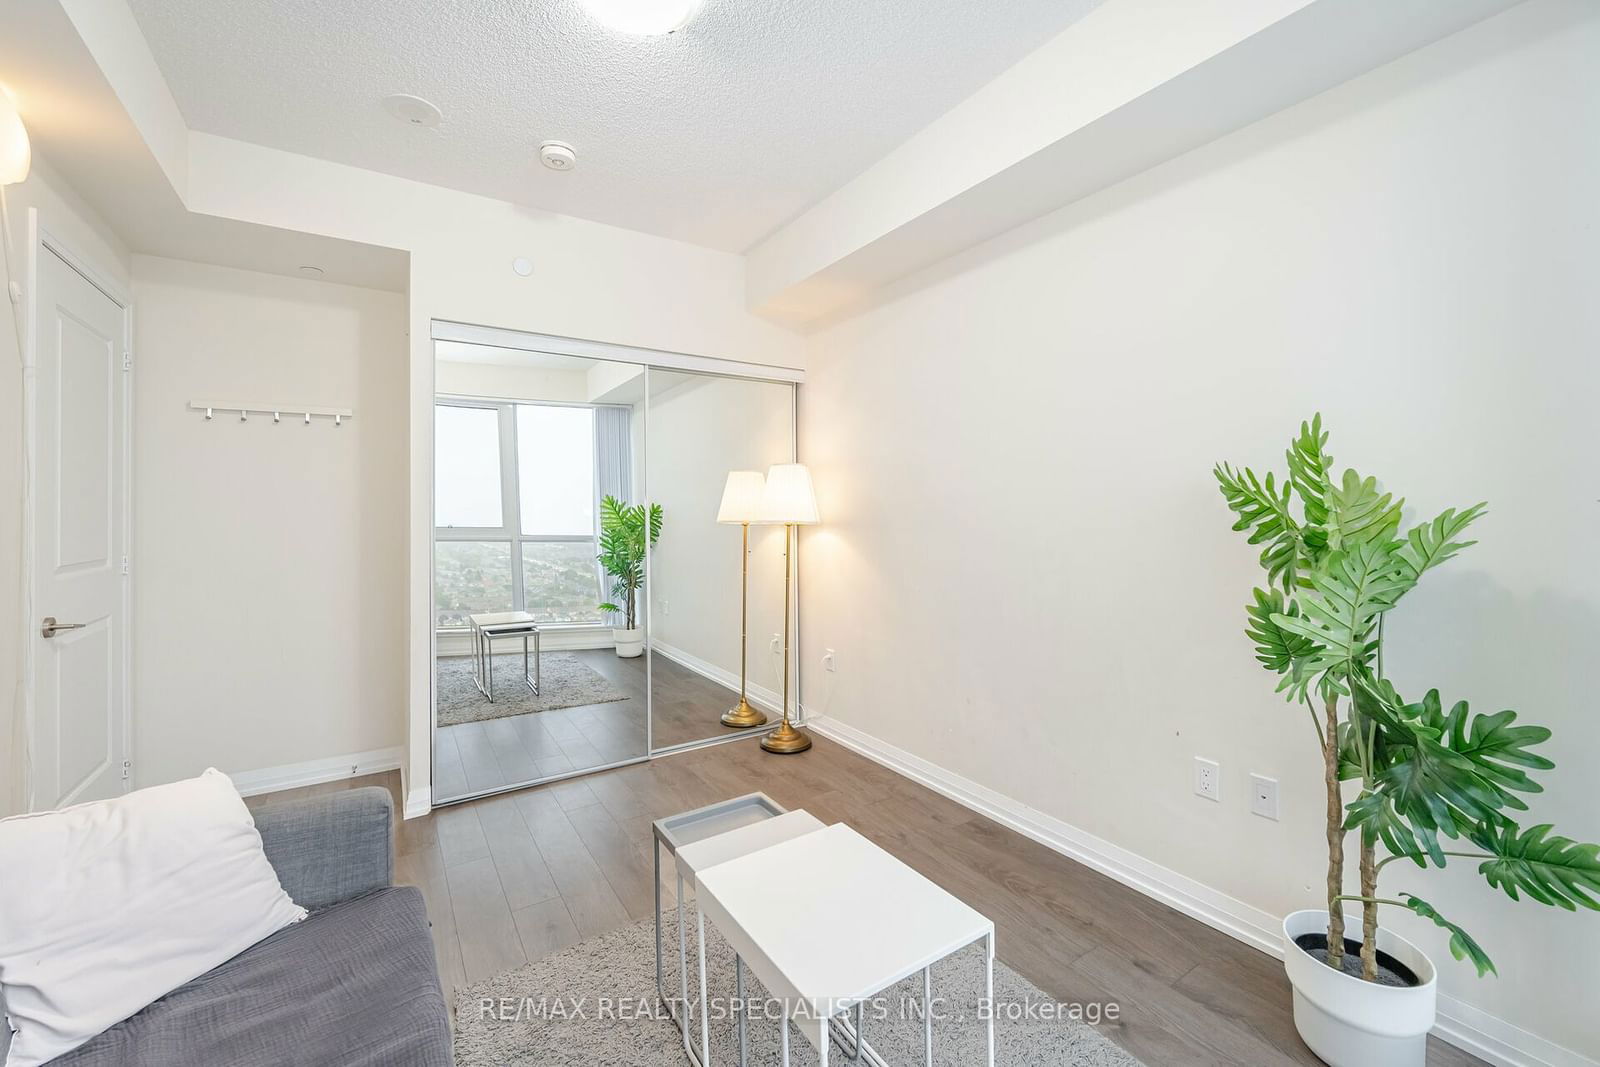
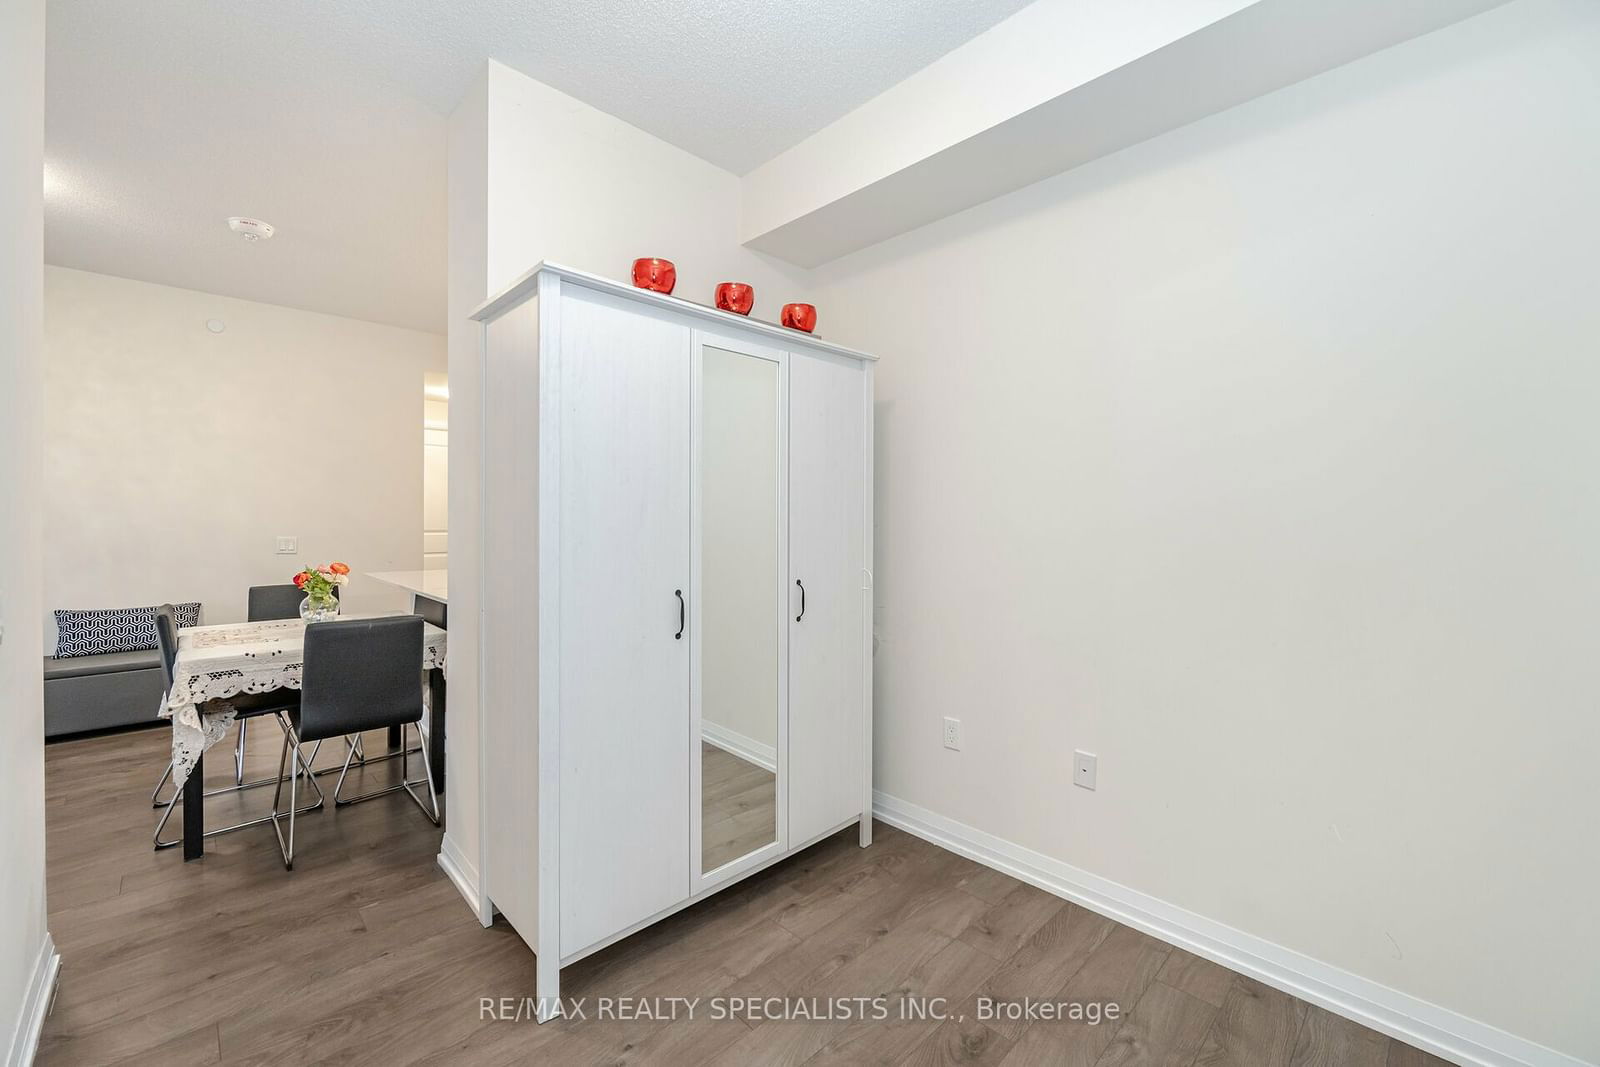
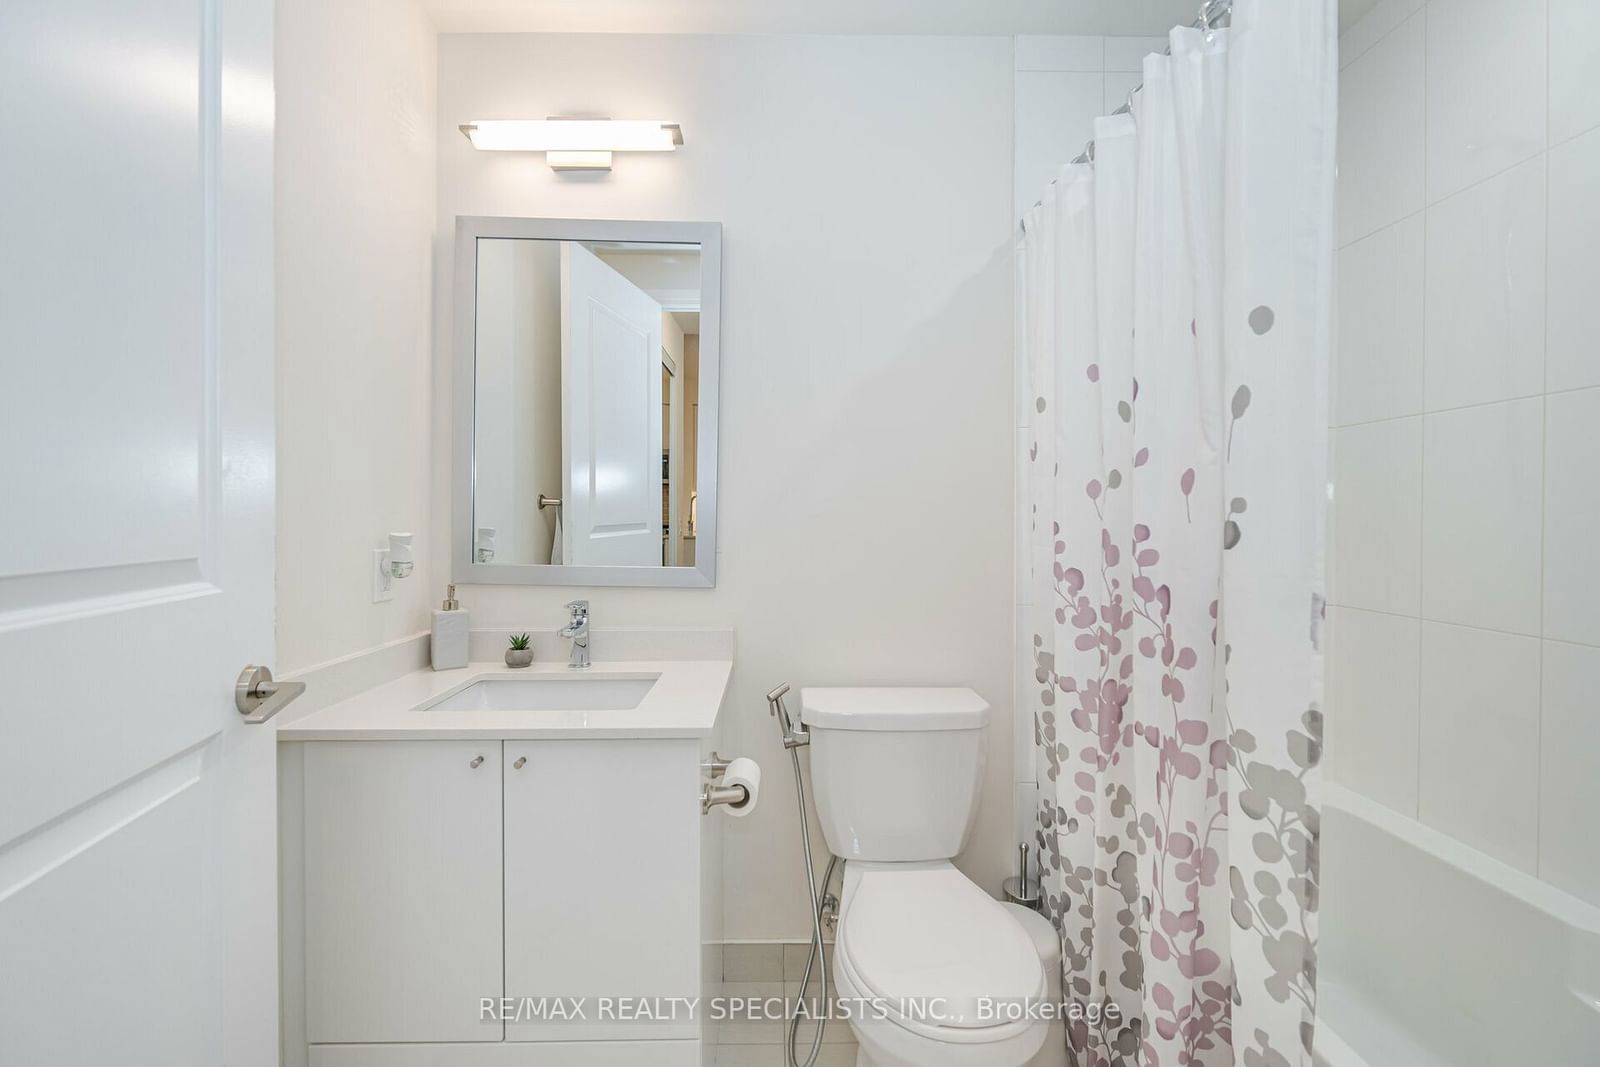
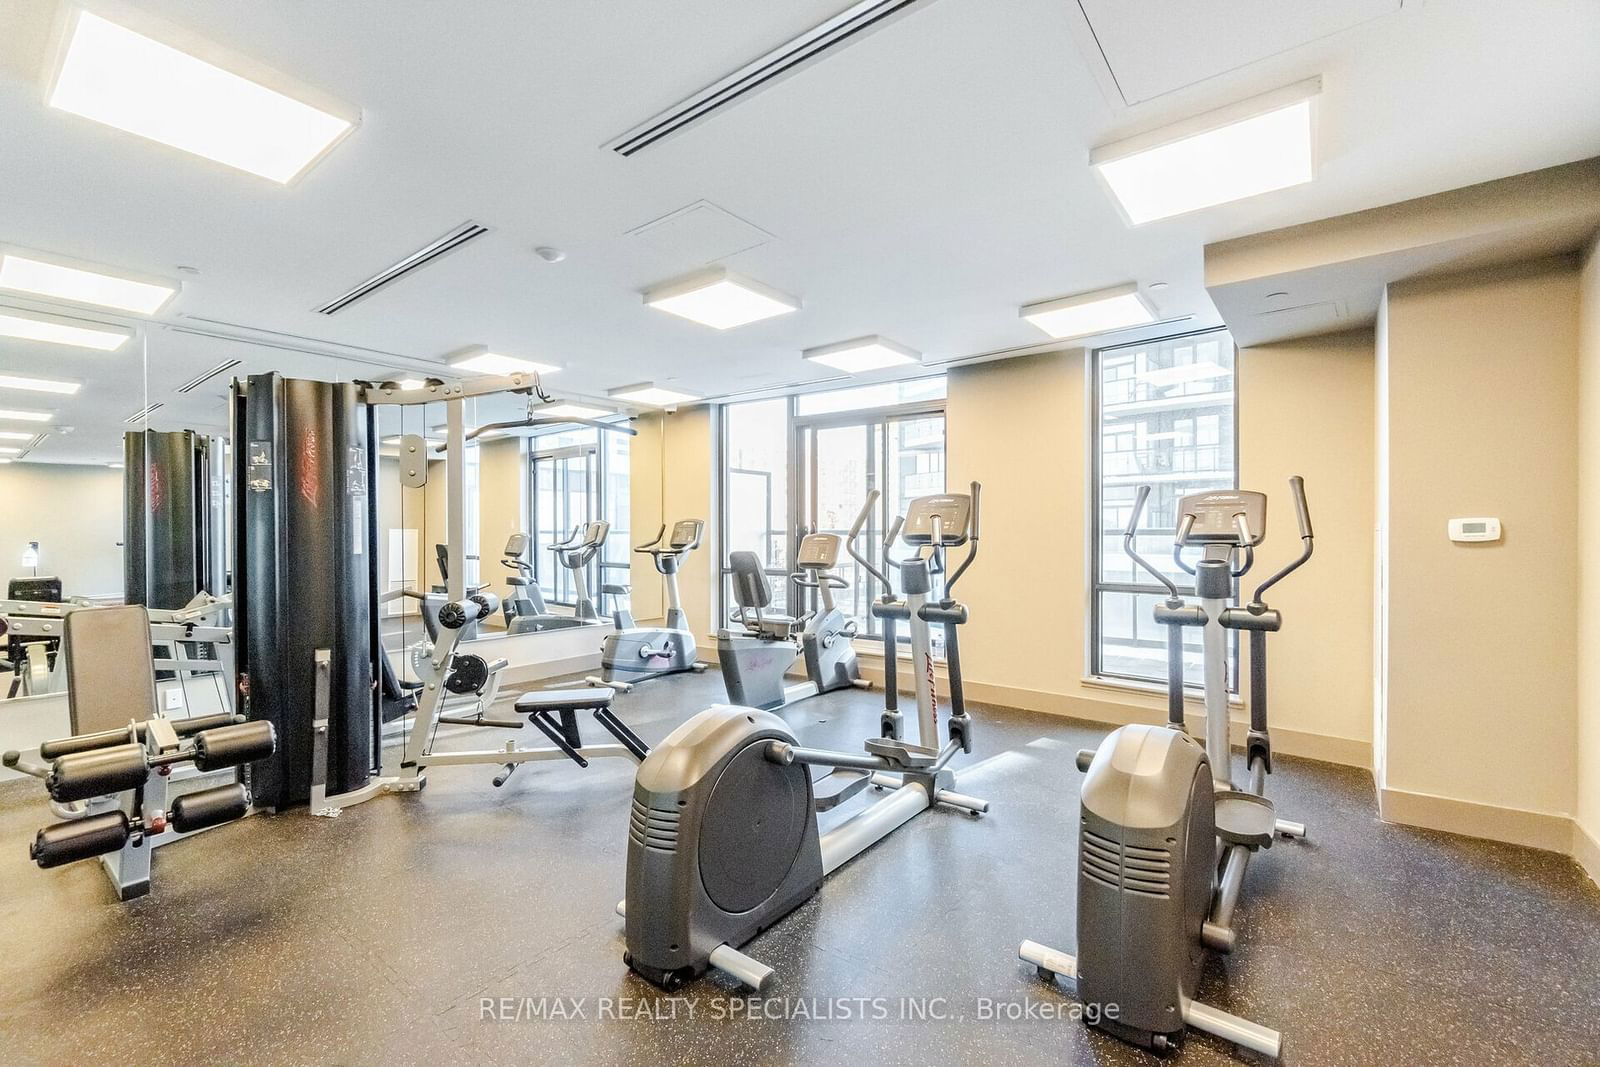
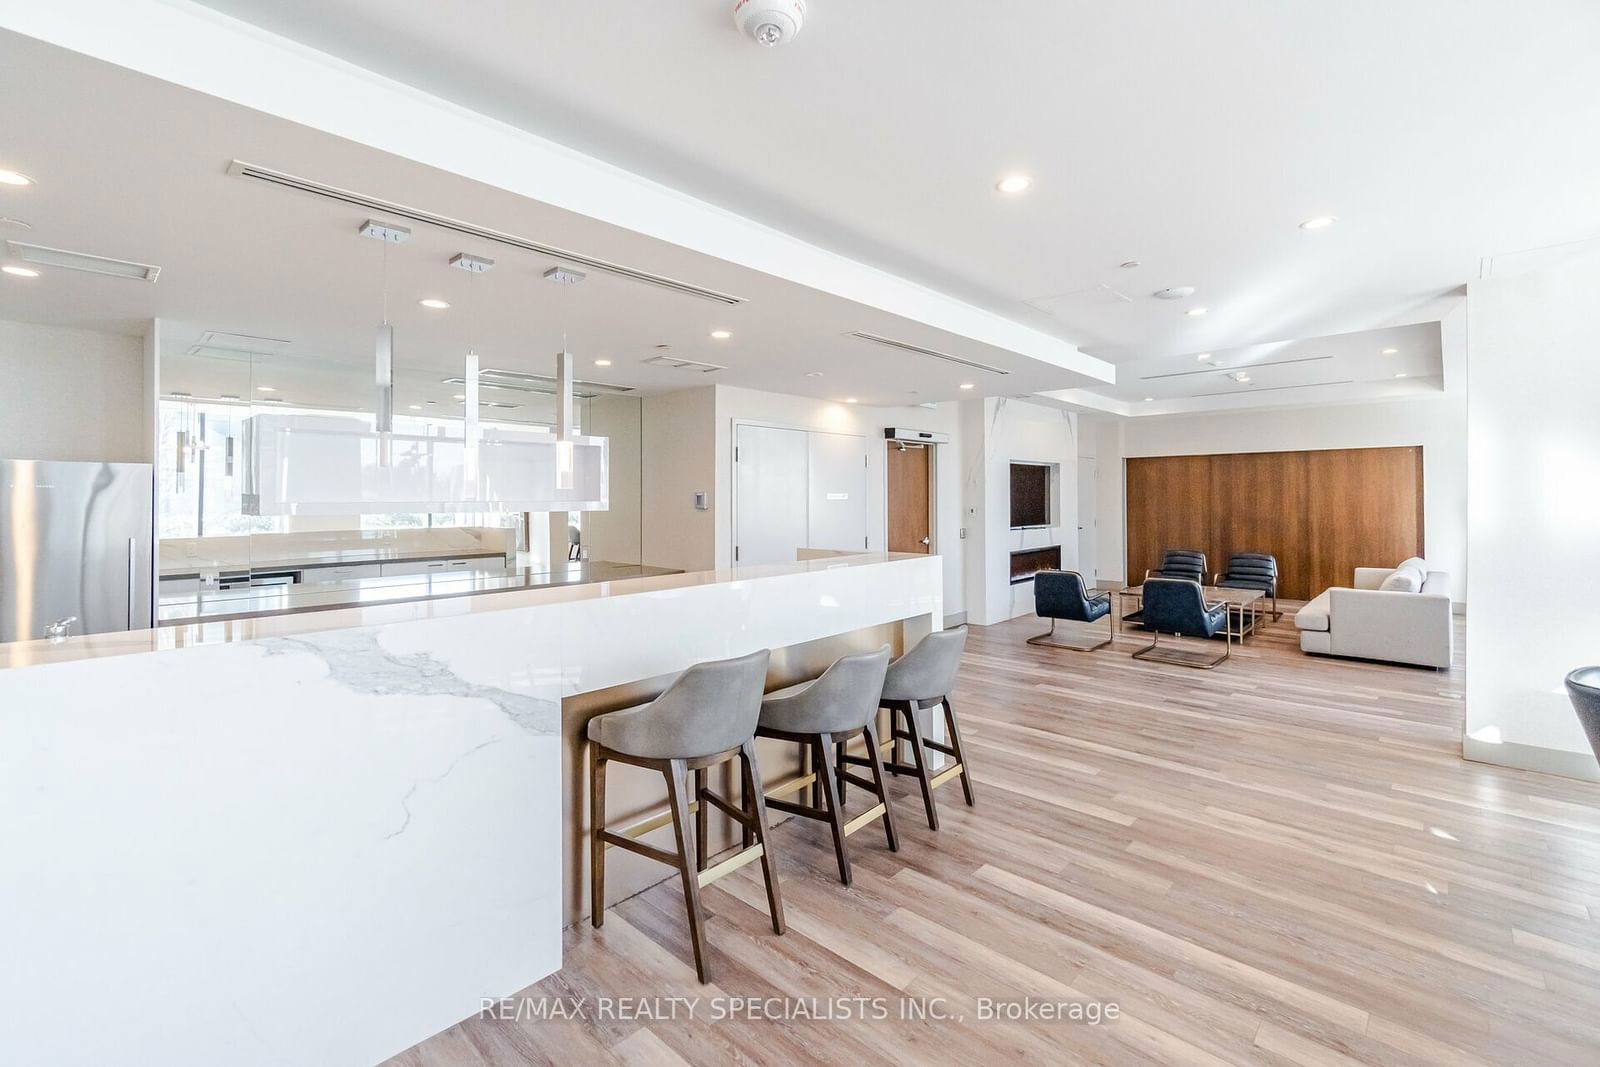
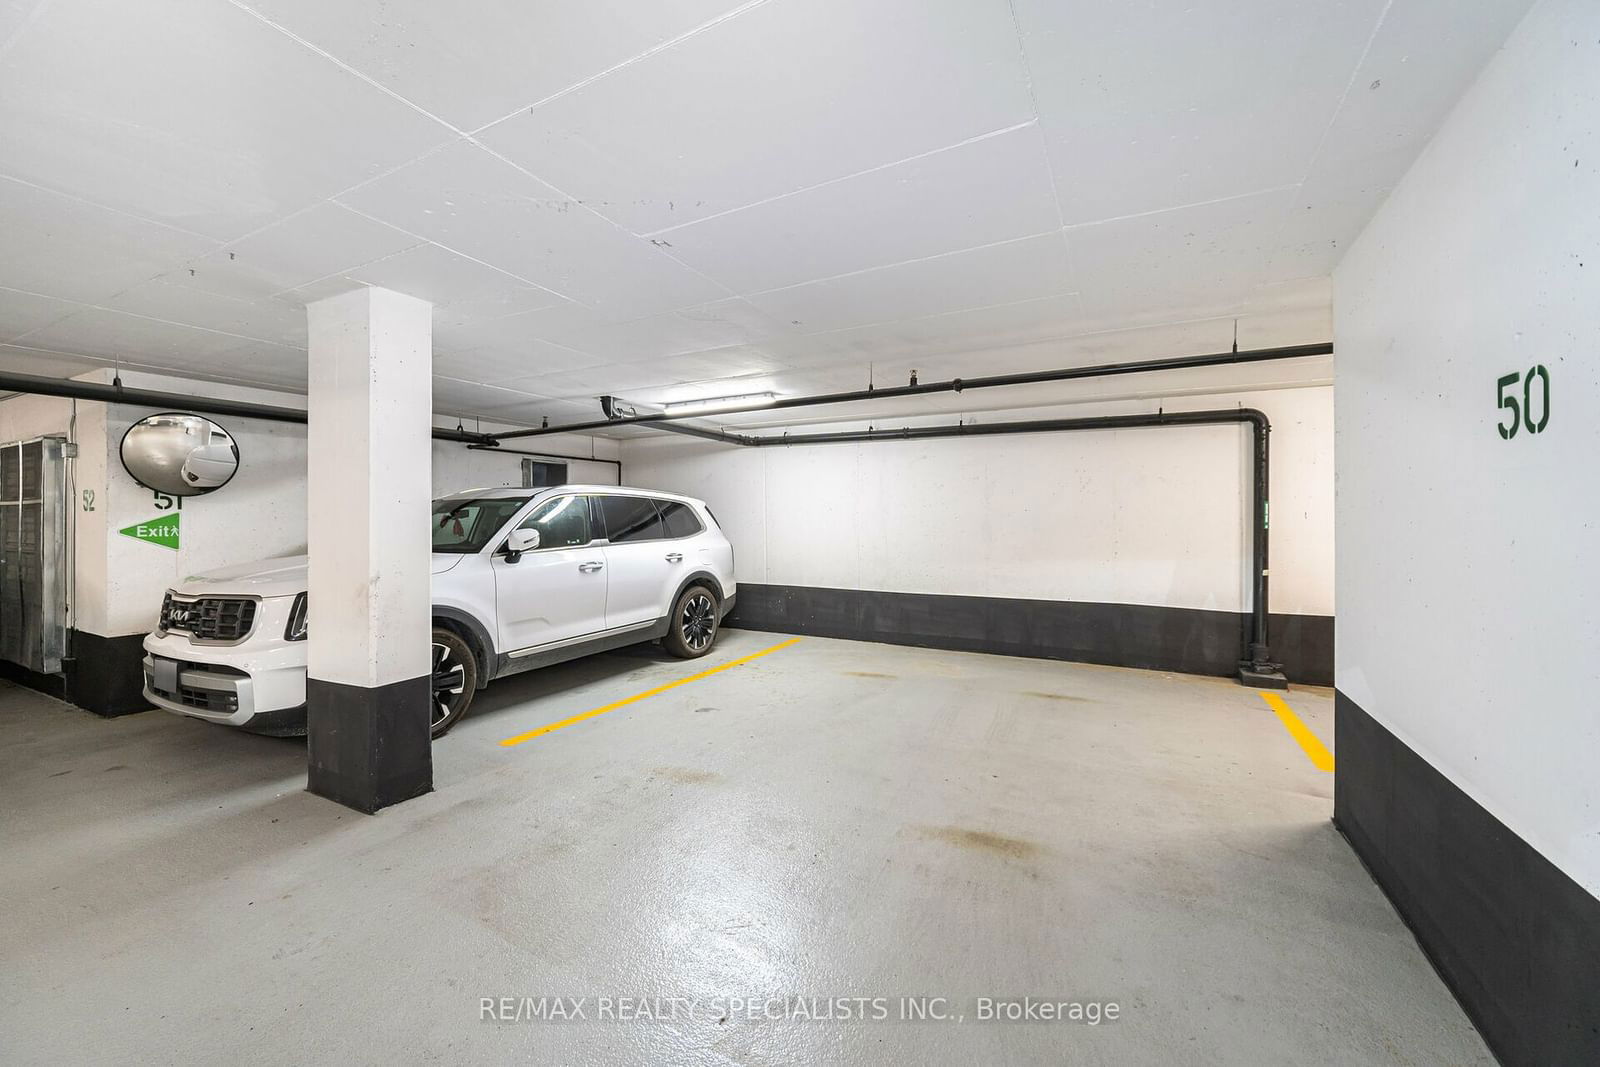
Beautiful, bright and new condo apartment located in a prime and highly convenient location in Mississauga. Spacious 2 bedroom + den (which can easily be used as an office and/or made into a separate room). 1,002 total SqFt (885 SqFt interior + 117 SqFt balcony). Large balcony offers spectacular unobstructed views of the city, lake and parks. 9Ft Ceiling, S/S Appliances. Extra wide parking spot. Close to public transit, restaurants, Square One Shopping Centre, bus terminal, major highways and future LRT. Perfect for first-time home buyers, downsizers or investors!
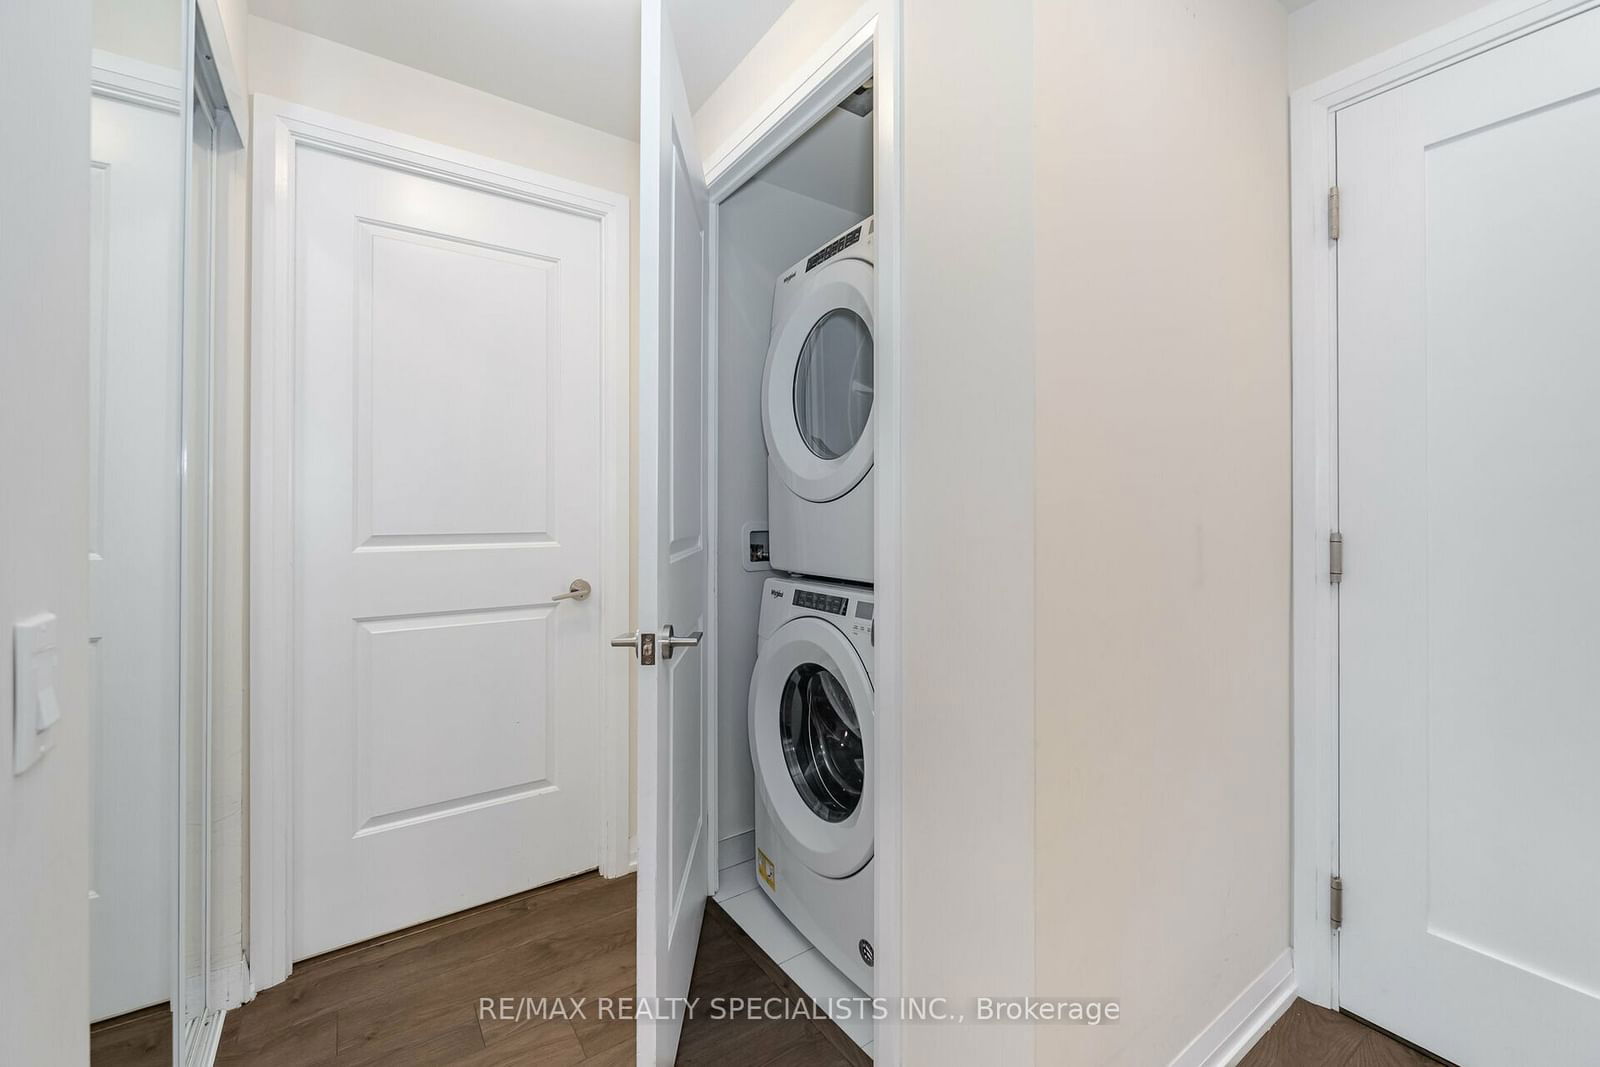
ExtrasAll Elfs. Stainless Steel Appliances: Fridge, Stove, Dishwasher, B/I Microwave. Washer & Dryer. 1 Locker and 1 Parking included.
re/max realty specialists inc.MLS® #W9507065
Amenities
Explore Neighbourhood
Similar Listings
Demographics
Based on the dissemination area as defined by Statistics Canada. A dissemination area contains, on average, approximately 200 – 400 households.
Price Trends
Maintenance Fees
Building Trends At Perla Towers
Days on Strata
List vs Selling Price
Offer Competition
Turnover of Units
Property Value
Price Ranking
Sold Units
Rented Units
Best Value Rank
Appreciation Rank
Rental Yield
High Demand
Transaction Insights at 35 Watergarden Drive
| 1 Bed | 1 Bed + Den | 2 Bed | 2 Bed + Den | 3 Bed | 3 Bed + Den | |
|---|---|---|---|---|---|---|
| Price Range | $530,000 - $550,000 | $518,500 - $610,000 | No Data | $737,000 - $790,000 | No Data | No Data |
| Avg. Cost Per Sqft | $891 | $842 | No Data | $756 | No Data | No Data |
| Price Range | $2,295 - $2,650 | $2,300 - $2,600 | $2,800 - $3,250 | $2,950 - $3,500 | No Data | No Data |
| Avg. Wait for Unit Availability | 34 Days | 70 Days | No Data | 34 Days | 370 Days | No Data |
| Avg. Wait for Unit Availability | 16 Days | 27 Days | 164 Days | 10 Days | 574 Days | No Data |
| Ratio of Units in Building | 31% | 18% | 4% | 47% | 2% | 1% |
Transactions vs Inventory
Total number of units listed and sold in Hurontario

